Quantcast
Channel: DirectX Developer Blog
Viewing all 291 articles
Browse latest View live

For best performance, use DXGI flip model

$
0
0

This document picks up where the MSDN “DXGI flip model” article and YouTube DirectX 12: Presentation Modes In Windows 10 and Presentation Enhancements in Windows 10: An Early Look videos left off.  It provides developer guidance on how to maximize performance and efficiency in the presentation stack on modern versions of Windows.


Call to action

If you are still using DXGI_SWAP_EFFECT_DISCARD or DXGI_SWAP_EFFECT_SEQUENTIAL (aka "blt" present model), it's time to stop!

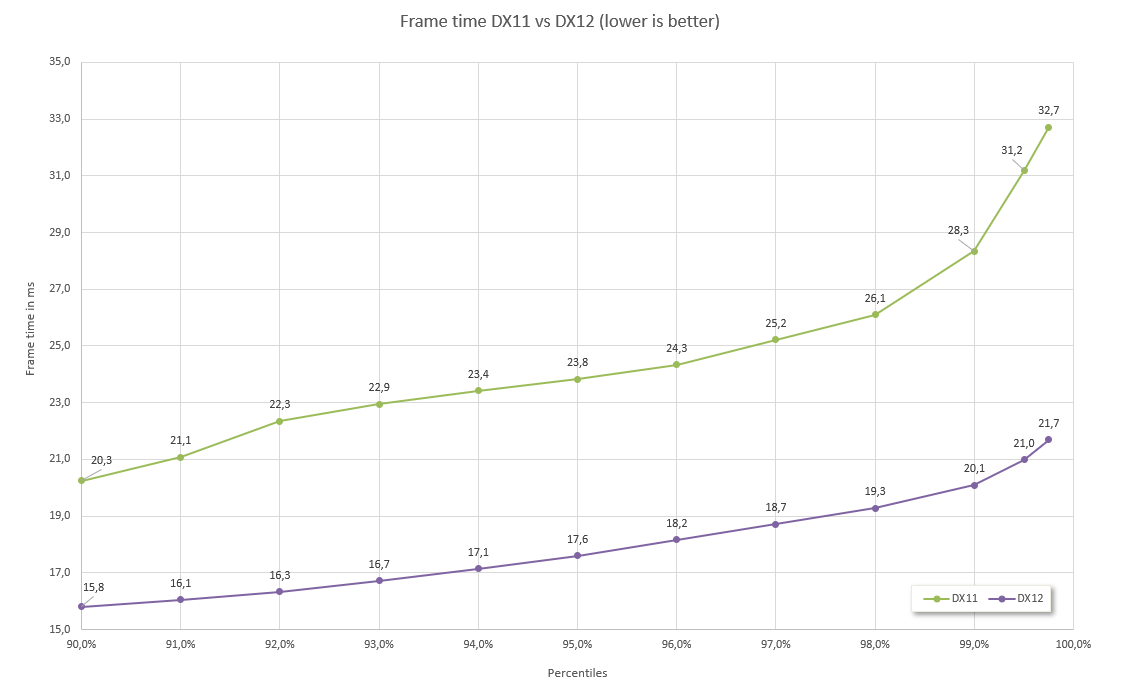
Switching to DXGI_SWAP_EFFECT_FLIP_SEQUENTIAL or DXGI_SWAP_EFFECT_FLIP_DISCARD (aka flip model) will give better performance, lower power usage, and provide a richer set of features.

Flip model presents go as far as making windowed mode effectively equivalent or better when compared to the classic "fullscreen exclusive" mode. In fact, we think it’s high time to reconsider whether your app actually needs a fullscreen exclusive mode, since the benefits of a flip model borderless window include faster Alt-Tab switching and better integration with modern display features.

Why now? Prior to the upcoming Spring Creators Update, blt model presents could result in visible tearing when used on hybrid GPU configurations, often found in high end laptops (see KB 3158621). In the Spring Creators Update, this tearing has been fixed, at the cost of some additional work. If you are doing blt presents at high framerates across hybrid GPUs, especially at high resolutions such as 4k, this additional work may affect overall performance.  To maintain best performance on these systems, switch from blt to flip present model. Additionally, consider reducing the resolution of your swapchain, especially if it isn’t the primary point of user interaction (as is often the case with VR preview windows).


A brief history

What is flip model? What is the alternative?

Prior to Windows 7, the only way to present contents from D3D was to "blt" or copy it into a surface which was owned by the window or screen. Beginning with D3D9’s FLIPEX swapeffect, and coming to DXGI through the FLIP_SEQUENTIAL swap effect in Windows 8, we’ve developed a more efficient way to put contents on screen, by sharing it directly with the desktop compositor, with minimal copies. See the original MSDN article for a high level overview of the technology.

This optimization is possible thanks to the DWM: the Desktop Window Manager, which is the compositor that drives the Windows desktop.


When should I use blt model?

There is one piece of functionality that flip model does not provide: the ability to have multiple different APIs producing contents, which all layer together into the same HWND, on a present-by-present basis. An example of this would be using D3D to draw a window background, and then GDI to draw something on top, or using two different graphics APIs, or two swapchains from the same API, to produce alternating frames. If you don’t require HWND-level interop between graphics components, then you don’t need blt model.

There is a second piece of functionality that was not provided in the original flip model design, but is available now, which is the ability to present at an unthrottled framerate. For an application which desires using sync interval 0, we do not recommend switching to flip model unless the IDXGIFactory5::CheckFeatureSupport API is available, and reports support for DXGI_FEATURE_PRESENT_ALLOW_TEARING.  This feature is nearly ubiquitous on recent versions of Windows 10 and on modern hardware.


What’s new in flip model?

If you’ve watched the YouTube video linked above, you’ll see talk about "Direct Flip" and "Independent Flip". These are optimizations that are enabled for applications using flip model swapchains. Depending on window and buffer configuration, it is possible to bypass desktop composition entirely, and directly send application frames to the screen, in the same way that exclusive fullscreen does.

These days, these optimizations can engage in one of 3 scenarios, with increasing functionality:

  1. DirectFlip: Your swapchain buffers match the screen dimensions, and your window client region covers the screen. Instead of using the DWM swapchain to display on the screen, the application swapchain is used instead.
  2. DirectFlip with panel fitters: Your window client region covers the screen, and your swapchain buffers are within some hardware-dependent scaling factor (e.g. 0.25x to 4x) of the screen. The GPU scanout hardware is used to scale your buffer while sending it to the display.
  3. DirectFlip with multi-plane overlay (MPO): Your swapchain buffers are within some hardware-dependent scaling factor of your window dimensions. The DWM is able to reserve a dedicated hardware scanout plane for your application, which is then scanned out and potentially stretched, to an alpha-blended sub-region of the screen.

With windowed flip model, the application can query hardware support for different DirectFlip scenarios and implement different types of dynamic scaling via use of IDXGIOutput6:: CheckHardwareCompositionSupport. One caveat to keep in mind is that if panel fitters are utilized, it’s possible for the cursor to suffer stretching side effects, which is indicated via DXGI_HARDWARE_COMPOSITION_SUPPORT_FLAG_CURSOR_STRETCHED.

Once your swapchain has been "DirectFlipped", then the DWM can go to sleep, and only wake up when something changes outside of your application. Your app frames are sent directly to screen, independently, with the same efficiency as fullscreen exclusive. This is "Independent Flip", and can engage in all of the above scenarios.  If other desktop contents come on top, the DWM can either seamlessly transition back to composed mode, efficiently "reverse compose" the contents on top of the application before flipping it, or leverage MPO to maintain the independent flip mode.

Check out the PresentMon tool to get insight into which of the above was used.


What else is new in flip model?

In addition to the above improvements, which apply to standard swapchains without anything special, there are several features available for flip model applications to use:

  • Decreasing latency using DXGI_SWAP_CHAIN_FLAG_FRAME_LATENCY_WAITABLE_OBJECT. When in Independent Flip mode, you can get down to 1 frame of latency on recent versions of Windows, with graceful fallback to the minimum possible when composed.
  • DXGI_SWAP_EFFECT_FLIP_DISCARD enables a "reverse composition" mode of direct flip, which results in less overall work to display the desktop. The DWM can scribble on the app buffers and send those to screen, instead of performing a full copy into their own swapchain.
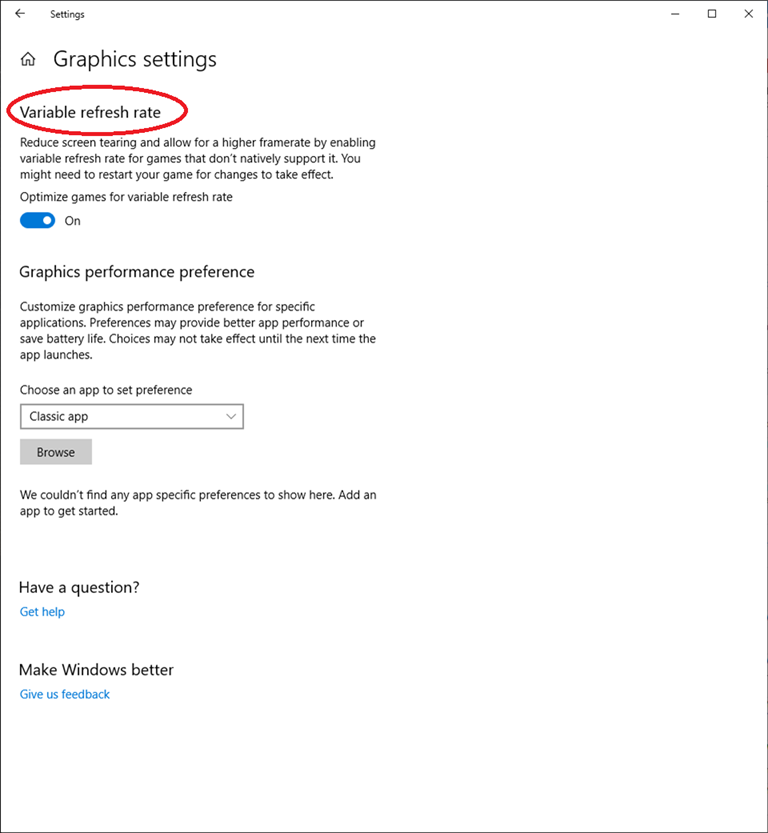
  • DXGI_SWAP_CHAIN_FLAG_ALLOW_TEARING can enable even lower latency than the waitable object, even in a window on systems with multi-plane overlay support.
  • Control over content scaling that happens during window resize, using the DXGI_SCALING property set during swapchain creation.
  • Content in HDR formats (R10G10B10A2_UNORM or R16G16B16A16_FLOAT) isn’t clamped unless it’s composed to a SDR desktop.
  • Present statistics are available in windowed mode.
  • Greater compatibility with UWP app-model and DX12 since these are only compatible with flip-model.


What do I have to do to use flip model?

Flip model swapchains have a few additional requirements on top of blt swapchains:

  1. The buffer count must be at least 2.
  2. After Present calls, the back buffer needs to explicitly be re-bound to the D3D11 immediate context before it can be used again.
  3. After calling SetFullscreenState, the app must call ResizeBuffers before Present.
  4. MSAA swapchains are not directly supported in flip model, so the app will need to do an MSAA resolve before issuing the Present.


How to choose the right rendering and presentation resolutions

The traditional pattern for apps in the past has been to provide the user with a list of resolutions to choose from when the user selects exclusive fullscreen mode. With the ability of modern displays to seamlessly begin scaling content, consider providing users with the ability to choose a rendering resolution for performance scaling, independent from an output resolution, and even in windowed mode. Furthermore, applications should leverage IDXGIOutput6:: CheckHardwareCompositionSupport to determine if they need to scale the content before presenting it, or if they should let the hardware do the scaling for them.

Your content may need to be migrated from one GPU to another as part of the present or composition operation. This is often true on multi-GPU laptops, or systems with external GPUs plugged in. As these configurations get more common, and as high-resolution displays become more common, the cost of presenting a full resolution swapchain increases.  If the target of your swapchain isn’t the primary point of user interaction, as is often the case with VR titles that present a 2D preview of the VR scene into a secondary window, consider using a lower resolution swapchain to minimize the amount of bandwidth that needs to be transferred across different GPUs.


Other considerations

The first time you ask the GPU to write to the swapchain back buffer is the time that the GPU will stall waiting for the buffer to become available. When possible, delay this point as far into the frame as possible.


DirectX Raytracing and the Windows 10 October 2018 Update

$
0
0

DirectX Raytracing and the Windows 10 October 2018 Update

The wait is finally over: we’re taking DirectX Raytracing (DXR) out of experimental mode!

Today, once you update to the next release of Windows 10, DirectX Raytracing will work out-of-box on supported hardware. And speaking of hardware, the first generation of graphics cards with native raytracing support is already available and works with the October 2018 Windows Update.

The first wave of DirectX Raytracing in games is coming soon, with the first three titles that support our API: Battlefield V, Metro Exodus and Shadow of the Tomb Raider. Gamers will be able to have raytracing on their machines in the near future!

Raytracing and Windows

We’ve worked for many years to make Windows the best platform for PC Gaming and believe that DirectX Raytracing is a major leap forward for gamers on our platform. We built DirectX Raytracing with ubiquity in mind: it’s an API that was built to work across hardware from all vendors.

Real-time raytracing is often quoted as being the holy grail of graphics and it’s a key part of a decades-long dream to achieve realism in games. Today marks a key milestone in making this dream a reality: gamers now have access to both the OS and hardware to support real-time raytracing in games. With the first few titles powered by DirectX Raytracing just around the corner, we’re about to take the first step into a raytraced future.

This was made possible with hard work here at Microsoft and the great partnerships that we have with the industry. Without the solid collaboration from our partners, today’s announcement would not have been possible.

What does this mean for gaming?

DirectX Raytracing allows games to achieve a level of realism unachievable by traditional rasterization. This is because raytracing excels in areas where traditional rasterization is lacking, such as reflections, shadows and ambient occlusion. We specifically designed our raytracing API to be used alongside rasterization-based game pipelines and for developers to be able to integrate DirectX Raytracing support into their existing engines, without the need to rebuild their game engines from the ground up.

The difference that raytracing makes to a game is immediately apparent and this is something that the industry recognizes: DXR is one of the fastest adopted features that we’ve released in recent years.

Several studios have partnered with our friends at NVIDIA, who created RTX technology to make DirectX Raytracing run as efficiently as possible on their hardware:

EA’s Battlefield V will have support for raytraced reflections.

These reflections are impossible in real-time games that use rasterization only: raytraced reflections include assets that are off-screen, adding a whole new level of immersion as seen in the image above.

Shadow of the Tomb Raider will have DirectX Raytracing-powered shadows.

The shadows in Shadow of the Tomb Raider showcase DirectX Raytracing's ability to render lifelike shadows and shadow interactions that more realistic than what’s ever been showcased in a game.

Metro Exodus will use DirectX Raytracing for global illumination and ambient occlusion

Metro Exodus will have high-fidelity natural lighting and contact shadows, resulting in an environment where light behaves just as it does in real life.

These games will be followed by the next wave of titles that make use of raytracing.

We’re still in the early days of DirectX Raytracing and are excited not just about the specific effects that have already been implemented using our API, but also about the road ahead.

DirectX Raytracing is well-suited to take advantage of today’s trends: we expect DXR to open an entirely new class of techniques and revolutionize the graphics industry.

DirectX Raytracing and hardware trends

Hardware has become increasingly flexible and general-purpose over the past decade: with the same TFLOPs today’s GPU can do more and we only expect this trend to continue.

We designed DirectX Raytracing with this in mind: by representing DXR as a compute-like workload, without complex state, we believe that the API is future-proof and well-aligned with the future evolution of GPUs: DXR workloads will fit naturally into the GPU pipelines of tomorrow.

DirectML

DirectX Raytracing benefits not only from advances in hardware becoming more general-purpose, but also from advances in software.

In addition to the progress we’ve made with DirectX Raytracing, we recently announced a new public API, DirectML, which will allow game developers to integrate inferencing into their games with a low-level API. To hear more about this technology, releasing in Spring 2019, check out our SIGGRAPH talk.

ML techniques such as denoising and super-resolution will allow hardware to achieve impressive raytraced effects with fewer rays per pixel. We expect DirectML to play a large role in making raytracing more mainstream.

DirectX Raytracing and Game Development

Developers in the future will be able to spend less time with expensive pre-computations generating custom lightmaps, shadow maps and ambient occlusion maps for each asset.

Realism will be easier to achieve for game engines: accurate shadows, lighting, reflections and ambient occlusion are a natural consequence of raytracing and don’t require extensive work refining and iterating on complicated scene-specific shaders.

EA’s SEED division, the folks who made the PICA PICA demo, offer a glimpse of what this might look like: they were able to achieve an extraordinarily high level of visual quality with only three artists on their team!

Crossing the Uncanny Valley

We expect the impact of widespread DirectX Raytracing in games to be beyond achieving specific effects and helping developers make their games faster.

The human brain is hardwired to detect realism and is especially sensitive to realism when looking at representations of people: we can intuitively feel when a character in a game looks and feels “right”, and much of this depends on accurate lighting. When a character gets really close to looking as a real human should, but slightly misses the mark, it becomes unnerving to look at. This effect is known as the uncanny valley.

Because true-to-life lighting is a natural consequence of raytracing, DirectX Raytracing will allow games to get much closer to crossing the uncanny valley, allowing developers to blur the line between the real and the fake. Games that fully cross the uncanny valley will gave gamers total immersion in their virtual environments and interactions with in-game characters. Simply put, DXR will make games much more believable.

How do I get the October 2018 Update?

As of 2pm PST today, this update is now available to the public. As with all our updates, rolling out the October 2018 Update will be a gradual process, meaning that not everyone will get it automatically on day one.

It’s easy to install this update manually: you’ll be able to update your machine using this link soon after 2pm PST on October 2nd.

Developers eager to start exploring the world of real-time raytracing should go to the directxtech forum’s raytracing board for the latest DirectX Raytracing spec, developer samples and our getting started guide.

Direct3D team office has a Wall of GPU History

$
0
0
When you are the team behind something like Direct3D, you need many different graphics cards to test on.  And when you’ve been doing this for as long as we have, you’ll inevitably accumulate a LOT of cards left over from years gone by.  What to do with them all?  One option would be to store boxes in someone’s office:

But it occurred to us that a better solution would be to turn one of our office hallways into a museum of GPU history:


402 different GPUs covering 35 years of hardware history later:

Our collection includes mainstream successes, influential breakthrough products, and also many more obscure cards that nevertheless bring back rich memories for those who worked on them.

It only covers discrete GPU configurations, because mobile parts and SoC components are less suitable for hanging on a wall 🙂   We think it’s pretty cool – check it out if you ever have a reason to visit the D3D team in person!

World of Warcraft uses DirectX 12 running on Windows 7

$
0
0

Blizzard added DirectX 12 support for their award-winning World of Warcraft game on Windows 10 in late 2018. This release received a warm welcome from gamers: thanks to DirectX 12 features such as multi-threading, WoW gamers experienced substantial framerate improvement. After seeing such performance wins for their gamers running DirectX 12 on Windows 10, Blizzard wanted to bring wins to their gamers who remain on Windows 7, where DirectX 12 was not available.

At Microsoft, we make every effort to respond to customer feedback, so when we received this feedback from Blizzard and other developers, we decided to act on it. Microsoft is pleased to announce that we have ported the user mode D3D12 runtime to Windows 7. This unblocks developers who want to take full advantage of the latest improvements in D3D12 while still supporting customers on older operating systems.

Today, with game patch 8.1.5 for World of Warcraft: Battle for Azeroth, Blizzard becomes the first game developer to use DirectX 12 for Windows 7! Now, Windows 7 WoW gamers can run the game using DirectX 12 and enjoy a framerate boost, though the best DirectX 12 performance will always be on Windows 10, since Windows 10 contains a number of OS optimizations designed to make DirectX 12 run even faster.

We’d like to thank the development community for their feedback. We’re so excited that we have been able to partner with our friends in the game development community to bring the benefits of DirectX 12 to all their customers. Please keep the feedback coming!


FAQ
Any other DirectX 12 game coming to Windows 7?
We are currently working with a few other game developers to port their D3D12 games to Windows 7. Please watch out for further announcement.

How are DirectX 12 games different between Windows 10 and Windows 7?
Windows 10 has critical OS improvements which make modern low-level graphics APIs (including DirectX 12) run more efficiently. If you enjoy your favorite games running with DirectX 12 on Windows 7, you should check how those games run even better on Windows 10!

World of Warcraft uses DirectX 12 running on Windows 7

$
0
0

Blizzard added DirectX 12 support for their award-winning World of Warcraft game on Windows 10 in late 2018. This release received a warm welcome from gamers: thanks to DirectX 12 features such as multi-threading, WoW gamers experienced substantial framerate improvement. After seeing such performance wins for their gamers running DirectX 12 on Windows 10, Blizzard wanted to bring wins to their gamers who remain on Windows 7, where DirectX 12 was not available.

At Microsoft, we make every effort to respond to customer feedback, so when we received this feedback from Blizzard and other developers, we decided to act on it. Microsoft is pleased to announce that we have ported the user mode D3D12 runtime to Windows 7. This unblocks developers who want to take full advantage of the latest improvements in D3D12 while still supporting customers on older operating systems.

Today, with game patch 8.1.5 for World of Warcraft: Battle for Azeroth, Blizzard becomes the first game developer to use DirectX 12 for Windows 7! Now, Windows 7 WoW gamers can run the game using DirectX 12 and enjoy a framerate boost, though the best DirectX 12 performance will always be on Windows 10, since Windows 10 contains a number of OS optimizations designed to make DirectX 12 run even faster.

We’d like to thank the development community for their feedback. We’re so excited that we have been able to partner with our friends in the game development community to bring the benefits of DirectX 12 to all their customers. Please keep the feedback coming!

FAQ
Any other DirectX 12 game coming to Windows 7?
We are currently working with a few other game developers to port their D3D12 games to Windows 7. Please watch out for further announcement.

How are DirectX 12 games different between Windows 10 and Windows 7?
Windows 10 has critical OS improvements which make modern low-level graphics APIs (including DirectX 12) run more efficiently. If you enjoy your favorite games running with DirectX 12 on Windows 7, you should check how those games run even better on Windows 10!

The post World of Warcraft uses DirectX 12 running on Windows 7 appeared first on DirectX Developer Blog.

Variable Rate Shading: a scalpel in a world of sledgehammers

$
0
0

One of the sides in the picture below is 14% faster when rendered on the same hardware, thanks to a new graphics feature available only on DirectX 12. Can you spot a difference in rendering quality?

Neither can we.  Which is why we’re very excited to announce that DirectX 12 is the first graphics API to offer broad hardware support for Variable Rate Shading.

What is Variable Rate Shading?

In a nutshell, it’s a powerful new API that gives the developers the ability to use GPUs more intelligently.

Let’s explain.

For each pixel in a screen, shaders are called to calculate the color this pixel should be. Shading rate refers to the resolution at which these shaders are called (which is different from the overall screen resolution). A higher shading rate means more visual fidelity, but more GPU cost; a lower shading rate means the opposite: lower visual fidelity that comes at a lower GPU cost.

Traditionally, when developers set a game’s shading rate, this shading rate is applied to all pixels in a frame.

There’s a problem with this: not all pixels are created equal.

VRS allows developers to selectively reduce the shading rate in areas of the frame where it won’t affect visual quality, letting them gain extra performance in their games. This is really exciting, because extra perf means increased framerates and lower-spec’d hardware being able to run better games than ever before.

VRS also lets developers do the opposite: using an increased shading rate only in areas where it matters most, meaning even better visual quality in games.

On top of that, we designed VRS to be extremely straightforward for developers to integrate into their engines. Only a few days of dev work integrating VRS support can result in large increases in performance.

Our VRS API lets developers set the shading rate in 3 different ways:

  • Per draw
  • Within a draw by using a screenspace image
  • Or within a draw, per primitive

There are two flavors, or tiers, of hardware with VRS support. The hardware that can support per-draw VRS hardware are Tier 1. There’s also a Tier 2, the hardware that can support both per-draw and within-draw variable rate shading.

Tier 1

By allowing developers to specify the per-draw shading rate, different draw calls can have different shading rates.

For example, a developer could draw a game’s large environment assets, assets in a faraway plane, or assets obscured behind semitransparency at a lower shading rate, while keeping a high shading rate for more detailed assets in a scene.

Tier 2

As mentioned above, Tier 2 hardware offer the same functionality and more, by also allowing developers to specify the shading rate within a draw, with a screenspace image or per-primitive. Let’s explain:

Screenspace image

Think of a screenspace image as reference image for what shading rate is used for what portion of the screen.

By allowing developers to specify the shading rate using a screenspace image, we open up the ability for a variety of techniques.

For example, foveated rendering, rendering the most detail in the area where the user is paying attention, and gradually decreasing the shading rate outside this area to save on performance. In a first-person shooter, the user is likely paying most attention to their crosshairs, and not much attention to the far edges of the screen, making FPS games an ideal candidate for this technique.

Another use case for a screenspace image is using an edge detection filter to determine the areas that need a higher shading rate, since edges are where aliasing happens. Once the locations of the edges are known, a developer can set the screenspace image based on that, shading the areas where the edges are with high detail, and reducing the shading rate in other areas of the screen. See below for more on this technique…

Per-primitive

Specifying the per-primitive shading rate means that developers can within a draw, specify the shading rate per triangle.

One use case for this would be for developers who know they are applying a depth-of-field blur in their game to render all triangles beyond some distance at a lower shading rate. This won’t lead to a degradation in visual quality, but will lead to an increase in performance, since these faraway triangles are going to be blurry anyway.

Developers won’t have to choose between techniques

We’re also introducing combiners, which allow developers to combine per-draw, screenspace image and per-primitive VRS at the same time. For example, a developer who’s using a screenspace image for foveated rendering can, using the VRS combiners, also apply per-primitive VRS to render faraway objects at lower shading rate.

What does this actually look like in practice?

We partnered with Firaxis games to see what VRS can do for a game on NVIDIA hardware that exists today.

They experimented with both adding both per-draw and per-screenspace image support to their game. These experiments were done using an GeForce RTX 2060 to draw at 4K resolution. Before adding VRS support, the scene they looked at would run at around 53 FPS.

Tier 1 support

Firaxis’s first experiment was to add Tier 1 support to their game: drawing terrain and water at a lower shading rate (2×2), and drawing smaller assets (vehicles, buildings and UI drawn) at a higher shading rate (1×1).

See if you can tell which one of these images is the game with Tier 1 VRS enabled and which one is the game without.

With this initial Tier 1 implementation they were able to see ~20% increase in FPS for this game map at this zoom

Tier 2 support

But is there a way to get even better quality, while still getting a significant performance improvement?

In the figure above, righthand image is the one with VRS ON – observant users might notice some slight visual degradations.

For this game, isolating the visual degradations on the righthand image and fixing them is not as simple as pointing to individual draw calls and adjusting their shading rates.

Parts of assets in the same draw require different shading rates to get optimal GPU performance without sacrificing visual quality, but luckily Tier 2’s screenspace image is here to help.

Using an edge detection filter to work out where high detail is required and then setting a screenspace image, Firaxis was still able to gain a performance win, while preserving lots of detail.

Now it’s almost impossible to tell which image has VRS ON and which one has VRS OFF:

This is the same image we started this article with. It’s the lefthand image that has VRS ON

For the same scene, Firaxis saw a 14% increase in FPS with their screenspace image implementation.

Firaxis also implemented a nifty screenspace image visualizer, for us graphics folks to see this in action:

Red indicates the areas where the shading rate is set to 1×1, and blue indicates where it’s at 2×2

Broad hardware support

In the DirectX team, we want to make sure that our features work on as much of our partners’ hardware as possible.

VRS support exists today on in-market NVIDIA hardware and on upcoming Intel hardware.

Intel’s already started doing experiments with variable rate shading on prototype Gen11 hardware, scheduled to come out this year.

With their initial proof-of-concept usage of VRS in UE4’s Sun Temple, they were able to show a significant performance win.

Above is a screenshot of this work, running on prototype Gen11 hardware.

To see their prototype hardware in action and for more info, come to Microsoft’s VRS announcement session and check out Intel’s booth at GDC.

PIX for Windows Support Available on Day 1

As we add more options to DX12 for our developers, we also make sure that they have the best tooling possible. PIX for Windows will support the VRS API from day 1 of the API’s release. PIX on Windows supports capturing and replaying VRS API calls, allowing developers to inspect the shading rate and its impact on their rendering work. The PIX download portal’s latest version of PIX has all these features.

All of this means that developers who want to integrate VRS support into their engines have tooling on day 1.

What Does This Mean for Games?

Developers now have an incredibly flexible tool in their toolbelt, allowing them to increase performance and quality without any invasive code changes.

In the future, once VRS hardware becomes more widespread, we expect an even wider range of hardware to be able to run graphically intensive games. Games taking full advantage of VRS will be able to use the extra performance to run at increased framerates, higher resolutions and with less aliasing.

Several studio and engine developers intend to add VRS support to their engines/games, including:


Available today!

Want to be one of the first to get VRS in your game?

Start by attending our Game Developer Conference sponsored sessions on Variable Rate Shading for all the technical details you need to start coding. Our first session will be an introduction to the feature. Come to our second session for deep dive into how implement VRS into your title.

Not attending GDC?  No problem!

We’ve updated the directxtech forums with a getting started guide, a link to the VRS spec and a link to a sample for developers to get started. We’ll also upload our slides after our GDC talks.


The post Variable Rate Shading: a scalpel in a world of sledgehammers appeared first on DirectX Developer Blog.

DirectML at GDC 2019

$
0
0
Introduction

Last year at GDC, we shared our excitement about the many possibilities for using machine learning in game development. If you’re unfamiliar with machine learning or neural networks, I strongly encourage you to check out our blog post from last year, which is a primer for many of the topics discussed in this post.

This year, we’re furthering our commitment to enable ML in games by making DirectML publicly available for the first time. We continuously engage with our customers and heard the need for a GPU-inferencing API that gives developers more control over their workloads to make integration with rendering engines easier. With DirectML, game developers write code once and their ML scenario works on all DX12-capable GPUs – a hardware agnostic solution at the operator level. We provide the consistency and performance required to integrate innovations in ML into rendering engines.

Additionally, Unity announced plans to support DirectML in their Unity Inference Engine that powers Unity ML Agents. Their decision to adopt DirectML was driven by the available hardware acceleration on Windows platforms while maintaining control of the data locality and the execution flow. By utilizing the regular graphics pipeline, they are saving on GPU stalls and have full integration with the rendering engine. Unity is in the process of integrating DirectML into their inference engine to allow developers to take advantage of metacommands and other optimizations available with DirectML.

A corgi holding a stick in Unity's ML Agents

We are very excited about our collaboration with Unity and the promise this brings to the industry. Providing developers fast inferencing across a broad set of platforms democratizes machine learning in games and improves the industry by proving out that ML can be integrated well with rendering work to enable novel experiences for gamers. With DirectML, we want to ensure that applications run well across all Windows hardware and empower developers to confidently ship machine learning models on lightweight laptops and hardcore gaming rigs alike. From a single model to a custom inference engine, DirectML will give you the most out of your hardware.


Why DirectML

Many new real-time inferencing scenarios have been introduced to the developer community over the last few years through cutting edge machine learning research. Some examples of these are super resolution, denoising, style transfer, game testing, and tools for animation and art. These models are computationally expensive but in many cases are required to run in real-time. DirectML enables these to run with high-performance by providing a wide set of optimized operators without the overhead of traditional inferencing engines.

Examples of operators provided in DirectML


To further enhance performance on the operators that customers need most, we work directly with hardware vendors, like Intel, AMD, and NVIDIA, to directly to provide architecture-specific optimizations, called metacommands. Newer hardware provides advances in ML performance through the use of FP16 precision and designated ML space on chips. DirectML’s metacommands provide vendors a way of exposing those advantages through their drivers to a common interface. Developers save the effort of hand tuning for individual hardware but get the benefits of these innovations.

DirectML is already providing some of these performance advantages by being the underlying foundation of WinML, our high-level inferencing engine that powers applications outside of gaming, like Adobe, Photos, Office, and Intelligent Ink. The API flexes its muscles by enabling applications to run on millions of Windows devices today.


Getting Started

DirectML is available today in the Windows Insider Preview and will be available more broadly in our next release of Windows. To help developers learn this exciting new technology, we provided a few resources below, including samples that show developers how to use DirectML in real-time scenarios and exhibit our recommended best practices.

Documentation: https://docs.microsoft.com/en-us/windows/desktop/direct3d12/dml

Samples: https://github.com/microsoft/DirectML-Samples

If you were unable to attend our GDC talk this year, slides containing more in-depth information about the API and best practices will be available here in the coming days. We will be releasing the super-resolution demo featured in this deck as an open source sample, coming soon. Stay tuned to the GitHub account above.

The post DirectML at GDC 2019 appeared first on DirectX Developer Blog.

New in D3D12 – DirectX Raytracing (DXR) now supports library subobjects

$
0
0

In the next update to Windows, codenamed 19H1, developers can specify DXR state subobjects inside a DXIL library. This provides an easier, flexible, and modular way of defining raytracing state, removing the need for repetitive boilerplate C++ code. This usability improvement was driven by feedback from early adopters of the API, so thanks to all those who took the time to share your experiences with us!

The D3D12RaytracingLibrarySubobjects sample illustrates using library subobjects in an application.

What are library subobjects?

Library subobjects are a way to configure raytracing pipeline state by defining subobjects directly within HLSL shader code. The following subobjects can be compiled from HLSL into a DXIL library:

  • D3D12_STATE_SUBOBJECT_TYPE_STATE_OBJECT_CONFIG
  • D3D12_STATE_SUBOBJECT_TYPE_GLOBAL_ROOT_SIGNATURE
  • D3D12_STATE_SUBOBJECT_TYPE_LOCAL_ROOT_SIGNATURE
  • D3D12_STATE_SUBOBJECT_TYPE_SUBOBJECT_TO_EXPORTS_ASSOCIATION
  • D3D12_STATE_SUBOBJECT_TYPE_RAYTRACING_SHADER_CONFIG
  • D3D12_STATE_SUBOBJECT_TYPE_RAYTRACING_PIPELINE_CONFIG
  • D3D12_STATE_SUBOBJECT_TYPE_HIT_GROUP

A library subobject is identified by a string name, and can be exported from a library or existing collection in a similar fashion to how shaders are exported using D3D12_EXPORT_DESC. Library subobjects also support renaming while exporting from libraries or collections. Renaming can be used to avoid name collisions, and to promote subobject reuse.

This example shows how to define subobjects in HLSL:

GlobalRootSignature MyGlobalRootSignature =
{
    "DescriptorTable(UAV(u0)),"                     // Output texture
    "SRV(t0),"                                      // Acceleration structure
    "CBV(b0),"                                      // Scene constants
    "DescriptorTable(SRV(t1, numDescriptors = 2))"  // Static index and vertex buffers.
};

LocalRootSignature MyLocalRootSignature = 
{
    "RootConstants(num32BitConstants = 4, b1)"  // Cube constants 
};

TriangleHitGroup MyHitGroup =
{
    "",                    // AnyHit
    "MyClosestHitShader",  // ClosestHit
};

ProceduralPrimitiveHitGroup MyProceduralHitGroup
{
    "MyAnyHit",       // AnyHit
    "MyClosestHit",   // ClosestHit
    "MyIntersection"  // Intersection
};

SubobjectToExportsAssociation MyLocalRootSignatureAssociation =
{
    "MyLocalRootSignature",    // Subobject name
    "MyHitGroup;MyMissShader"  // Exports association 
};

RaytracingShaderConfig MyShaderConfig =
{
    16,  // Max payload size
    8    // Max attribute size
};

RaytracingPipelineConfig MyPipelineConfig =
{
    1  // Max trace recursion depth
};

StateObjectConfig MyStateObjectConfig = 
{ 
    STATE_OBJECT_FLAGS_ALLOW_LOCAL_DEPENDENCIES_ON_EXTERNAL_DEFINITONS
};

Note that the subobject names used in an association subobject need not be defined within the same library or even collection, and can be imported from different libraries within same collection or a different collection altogether. In cases where a subobject definition is used from a different collection, the collection that provides the subobject definitions must use the state object config flag D3D12_STATE_OBJECT_FLAG_ALLOW_EXTERNAL_DEPENDENCIES_ON_LOCAL_DEFINITIONS, and the collection which depends on the external definitions of the subobject must specify the config flag D3D12_STATE_OBJECT_FLAG_ALLOW_LOCAL_DEPENDENCIES_ON_EXTERNAL_DEFINITIONS.

Subobject associations at library scope

(this section is included for completeness: most readers can probably ignore these details)

Library subobjects follow rules for default associations. An associable subobject (config or root signature subobject) becomes a candidate for implicit default association if it is the only subobject of its type defined in the library, and if it is not explicitly associated to any shader export. Use of default associable subobject can be explicitly specified by giving an empty list of shader exports in the SubobjectToExportsAssociation definition. Note that the scope of the defaults only applies to the shaders defined in the library. Also note that similar to non-explicit associations, the associable subobjects names specified in SubobjectToExportsAssociation need not be defined in the same library, and this definition can come from a different library or even different collection.

Subobject associations (i.e. config and root signature association between subobjects and shaders) defined at library scope have lower priority than the ones defined at collection or state object scope. This includes all explicit and default associations. For example, an explicit config or root signature association to a hit group defined at library scope can be overridden by an implicit default association at state object scope.

Subobject associations can be elevated to state object scope by using a SubobjectToExportsAssociation subobject at state object scope. This association will have equal priority to other state object scope associations, and the D3D12 runtime will report errors if multiple inconsistent associations are found for a given shader.

Creating Root Signatures from DXIL library bytecode

In DXR, if an application wants to use a global root signature in a DispatchRays() call then it must first bind the global root signature to the command list via SetComputeRootSignature(). For DXIL-defined global root signatures, the application must call SetComputeRootSignature() with an ID3D12RootSignature* that matches the DXIL-defined global root signature. To make this easier for developers, the D3D12 CreateRootSignature API has been updated to accept DXIL library bytecode and will create a root signature from the global root signature subobject defined in that DXIL library. The requirement here is that there should be only one global root signature defined in the DXIL library. The runtime and debug layer will report an error if this API is used with library bytecode having none or multiple global root signatures.

Similarly, the APIs D3D12CreateRootSignatureDeserializer and D3D12CreateVersionedRootSignatureDeserializer are updated to create root signature deserializers from library bytecode that defines one global root signature subobject.

Requirements

Windows SDK version 18282 or higher is required for the DXC compiler update. OS version 18290 or higher is needed for runtime and debug layer binaries. Both are available today through the Windows Insider Program. PIX supports library subobjects as of version 1901.28. This feature does not require a driver update.

The post New in D3D12 – DirectX Raytracing (DXR) now supports library subobjects appeared first on DirectX Developer Blog.


New in D3D12 – GPU-Based Validation (GBV) is now available for Shader Model 6.x

$
0
0

In the next update to Windows, codenamed 19H1, the DirectX12 debug layer adds support for GPU-based validation (GBV) of shader model 6.x (DXIL) as well as the previously supported shader model 5.x (DXBC).

GBV is a GPU timeline validation that modifies and injects validation instructions directly into application shaders. It can provide more detailed validation than is possible using CPU validation alone. In previous Windows releases, GBV modified DXBC shaders to provide validations such as resource state tracking, out-of-bound buffer accesses, uninitialized resource and descriptor bindings, and resource promotion/decay validation. With the 19H1 release, the debug layer provides all these validations for DXIL based shaders as well.

This support is available today in the latest 19H1 builds accessible through the Windows Insider Program.

How to enable GPU-based validation for applications using DXIL shaders

No additional step is needed to enable DXIL GBV. The traditional method is extended to support DXIL based shader patching as well as DXBC:

void EnableShaderBasedValidation()
{
    CComPtr<ID3D12Debug> spDebugController0;
    CComPtr<ID3D12Debug1> spDebugController1;

    VERIFY(D3D12GetDebugInterface(IID_PPV_ARGS(&spDebugController0)));
    VERIFY(spDebugController0->QueryInterface(IID_PPV_ARGS(&spDebugController1)));
    spDebugController1->SetEnableGPUBasedValidation(true);
}

The post New in D3D12 – GPU-Based Validation (GBV) is now available for Shader Model 6.x appeared first on DirectX Developer Blog.

DirectX engineering specs published

$
0
0

Engineering specs for a number of DirectX features, including DirectX Raytracing, Variable Rate Shading, and all of D3D11, are now available at https://microsoft.github.io/DirectX-Specs. This supplements the official API documentation with an extra level of detail that can be useful to expert developers.

The specs are licensed under Creative Commons. We welcome contributions to clarify, add missing detail, or better organize the material.

The post DirectX engineering specs published appeared first on DirectX Developer Blog.

New in D3D12 – background shader optimizations

$
0
0

tl;dr;

In the next update to Windows, codenamed 19H1, D3D12 will allow drivers to use idle priority background CPU threads to dynamically recompile shader programs. This can improve GPU performance by specializing shader code to better match details of the hardware it is running on and/or the context in which it is being used. Developers don’t have to do anything to benefit from this feature – as drivers start to use it, existing shaders will automatically be tuned more efficiently. But developers who are profiling their code may wish to use the new SetBackgroundProcessingMode API to control how and when these optimizations take place.

How shader compilation is changing

Creating a D3D12 pipeline state object is a synchronous operation. The API call does not return until all shaders have been fully compiled into ready-to-execute GPU instructions. This approach is simple, provides deterministic performance, and gives sophisticated applications control over things like compiling shaders ahead of time or compiling several in parallel on different threads, but in other ways it is quite limiting.

Most D3D11 drivers, on the other hand, implement shader creation by automatically offloading compilation to a worker thread. This is transparent to the caller, and works well as long as the compilation has finished by the time the shader is needed. A sophisticated driver might do things like compiling the shader once quickly with minimal optimization so as to be ready for use as soon as possible, and then again using a lower priority thread with more aggressive (and hence time consuming) optimizations. Or the implementation might monitor how a shader is used, and over time recompile different versions of it, each one specialized to boost performance in a different situation. This kind of technique can improve GPU performance, but the lack of developer control isn’t ideal. It can be hard to schedule GPU work appropriately when you don’t know for sure when each shader is ready to use, and profiling gets tricky when drivers can swap the shader out from under you at any time! If you measure 10 times and get 10 different results, how can you be sure whether the change you are trying to measure was an improvement or not?

In the 19H1 update to Windows, D3D12 is adding support for background shader recompilation. Pipeline state creation remains synchronous, so (unlike with D3D11) you always know for sure exactly when a shader is ready to start rendering. But now, after the initial state object creation, drivers can submit background recompilation requests at any time. These run at idle thread priority so as not to interfere with the foreground application, and can be used to implement the same kinds of dynamic optimization that were possible with the D3D11 design. At the same time, we are adding an API to control this behavior during profiling, so D3D12 developers will still be able to measure just once and get one reliable result.

How to use it

  1. Have recent build of Windows 19H1 (as of this writing, available through the Windows Insider Program)
  2. Have a driver that implements this feature
  3. That’s it, you’re done!

Surely there’s more to it?

Well ok. While profiling, you probably want to use SetBackgroundProcessingMode to make sure these dynamic optimizations get applied before you take timing measurements. For example:

SetBackgroundProcessingMode(
    D3D12_BACKGROUND_PROCESSING_MODE_ALLOW_INTRUSIVE_MEASUREMENTS,
    D3D_MEASUREMENTS_ACTION_KEEP_ALL,
    null, null);

// prime the system by rendering some typical content, e.g. a level flythrough

SetBackgroundProcessingMode(
    D3D12_BACKGROUND_PROCESSING_MODE_ALLOWED,
    D3D12_MEASUREMENTS_ACTION_COMMIT_RESULTS,
    null, null);

// continue rendering, now with dynamic optimizations applied, and take your measurements

API details

Dynamic optimization state is controlled by a single new API:

HRESULT ID3D12Device6::SetBackgroundProcessingMode(D3D12_BACKGROUND_PROCESSING_MODE Mode,
                                                   D3D12_MEASUREMENTS_ACTION MeasurementsAction,
                                                   HANDLE hEventToSignalUponCompletion,
                                                   _Out_opt_ BOOL* FurtherMeasurementsDesired);

enum D3D12_BACKGROUND_PROCESSING_MODE
{
    D3D12_BACKGROUND_PROCESSING_MODE_ALLOWED,
    D3D12_BACKGROUND_PROCESSING_MODE_ALLOW_INTRUSIVE_MEASUREMENTS,
    D3D12_BACKGROUND_PROCESSING_MODE_DISABLE_BACKGROUND_WORK,
    D3D12_BACKGROUND_PROCESSING_MODE_DISABLE_PROFILING_BY_SYSTEM,
};

enum D3D12_MEASUREMENTS_ACTION
{
    D3D12_MEASUREMENTS_ACTION_KEEP_ALL,
    D3D12_MEASUREMENTS_ACTION_COMMIT_RESULTS,
    D3D12_MEASUREMENTS_ACTION_COMMIT_RESULTS_HIGH_PRIORITY,
    D3D12_MEASUREMENTS_ACTION_DISCARD_PREVIOUS,
};

The BACKGROUND_PROCESSING_MODE setting controls what level of dynamic optimization will apply to GPU work that is submitted in the future:

  • ALLOWED is the default setting. The driver may instrument workloads and dynamically recompile shaders in a low overhead, non-intrusive manner which avoids glitching the foreground workload.
  • ALLOW_INTRUSIVE_MEASUREMENTS indicates that the driver may instrument as aggressively as possible. Causing glitches is fine while in this mode, because the current work is being submitted specifically to train the system.
  • DISABLE_BACKGROUND_WORK means stop it! No background shader recompiles that chew up CPU cycles, please.
  • DISABLE_PROFILING_BY_SYSTEM means no, seriously, stop it for real! I’m doing an A/B performance comparison, and need the driver not to change ANYTHING that could mess up my results.

MEASUREMENTS_ACTION, on the other hand, indicates what should be done with the results of earlier workload instrumentation:

  • KEEP_ALL – nothing to see here, just carry on as you are.
  • COMMIT_RESULTS indicates that whatever the driver has measured so far is all the data it is ever going to see, so it should stop waiting for more and go ahead compiling optimized shaders. hEventToSignalUponCompletion will be signaled when all resulting compilations have finished.
  • COMMIT_RESULTS_HIGH_PRIORITY is like COMMIT_RESULTS, but also indicates the app does not care about glitches, so the runtime should ignore the usual idle priority rules and go ahead using as many threads as possible to get shader recompiles done fast.
  • DISCARD_PREVIOUS requests to reset the optimization state, hinting that whatever has previously been measured no longer applies.

Note that the DISABLE_BACKGROUND_WORK, DISABLE_PROFILING_BY_SYSTEM, and COMMIT_RESULTS_HIGH_PRIORITY options are only available in developer mode.

What about PIX?

PIX will automatically use SetBackgroundProcessingMode, first to prime the system and then to prevent any further changes from taking place in the middle of its analysis. It will wait on an event to make sure all background shader recompiles have finished before it starts taking measurements.

Since this will be handled automatically by PIX, the detail is only relevant if you’re building a similar tool of your own:

BOOL wantMoreProfiling = true;
int tries = 0;

while (wantMoreProfiling && ++tries < MaxPassesInCaseDriverDoesntConverge)
{
    SetBackgroundProcessingMode(
        D3D12_BACKGROUND_PROCESSING_MODE_ALLOW_INTRUSIVE_MEASUREMENTS,
        (tries == 0) ? D3D12_MEASUREMENTS_ACTION_DISCARD_PREVIOUS : D3D12_MEASUREMENTS_ACTION_KEEP_ALL,
        null, null);

    // play back the frame that is being analyzed

    SetBackgroundProcessingMode(
        D3D12_BACKGROUND_PROCESSING_MODE_DISABLE_PROFILING_BY_SYSTEM,
        D3D12_MEASUREMENTS_ACTION_COMMIT_RESULTS_HIGH_PRIORITY,
        handle,
        &wantMoreProfiling);

    WaitForSingleObject(handle);
}

// play back the frame 1+ more times while collecting timing data,
// recording GPU counters, doing A/B perf comparisons, etc.

The post New in D3D12 – background shader optimizations appeared first on DirectX Developer Blog.

DirectX 12 boosts performance of HITMAN 2

$
0
0

Our partners at IO Interactive, the developers of the award-winning HITMAN franchise, recently added DirectX 12 support to HITMAN 2, with impressive results.  IO Interactive was so excited that they wanted to share a bit about how their innovative use of DirectX 12 benefits HITMAN gamers everywhere.

The guest post below is from IO Interactive:

DirectX 12 boosts performance of HITMAN 2

by Brian Rasmussen, Technical Producer, IO Interactive

With the latest update HITMAN 2 is available for DirectX 12 and users report improved performance in many cases. HITMAN 2 is a great candidate for taking advantage of DirectX 12’s ability to distribute rendering across multiple CPU cores, which allows us to reduce the frame time considerably in many cases. The realized benefits depend on the both the game content and the available hardware.

In this post, we look at how HITMAN 2 uses DirectX 12 to improve performance and provide some guidelines for what to expect.

Highly detailed graphics requires both CPU and GPU work

Figure 1 – The Miami level in Hitman 2 benefits greatly from the multithreaded rendering in DirectX 12

HITMAN 2 levels such as Miami and Mumbai are set in highly detailed environments and populated with big crowds with multiple interaction systems that react intelligently to the player’s actions.

Rendering these game levels often requires more than ten thousand draw calls per frame. This easily becomes a CPU bottleneck as there’s not enough time in a frame to submit all the draw calls to the GPU on a single threaded renderer.

DirectX 12 allows draw calls to be distributed across multiple threads which allows the game engine to submit more rendering work than previously possible. This improves the frame time of exciting game levels and allows us to create new content with even higher level of details in the future.

With its big crowds and complex AI HITMAN 2 is very CPU intensive, so we have built an architecture that allows us to take advantage of the available hardware resources. The Glacier engine powering HITMAN 2 uses a job scheduler to distribute CPU workloads across the available cores, so we already have the necessary engine infrastructure to take advantage of DirectX 12.

Multithreaded rendering

With DirectX 12 we can use the job scheduling mechanism of our game engine to distribute rendering submissions across available CPU cores. For complex game levels this offers substantial reductions in the time needed to submit rendering to the GPU and consequently reduces the frame time significantly.

The graph below shows results from one of our internal stutter analysis performance tests. Vertically it shows frame time (lower is better) and horizontally it shows percentiles for the performance samples. For DirectX 11, 99% of the captured frames rendered in 28.2ms or less on this hardware, and for DirectX 12, 99% of the captured frames rendered in 20.1ms.

The graph shows a significant reduction of the frame time across all the samples leading to a much smoother game experience. For instance, based on the numbers above the game rendered at 35 FPS 99% of the time on DirectX 11. On DirectX 12 this increases to 50 FPS, or close to a 43% improvement.

Figure 2 – The DirectX 12 version of HITMAN 2 shows consistently reduced frame time on complex game levels

The data was gathered on a 6 core Haswell CPU with an AMD Fury X GPU. We expect to see performance improvements on PCs with a similar or better GPU and at least four available CPU cores.

For less capable systems we recommend staying with the DirectX 11 version of HITMAN 2. Our DirectX 11 implementation offers slightly better performance on lower end systems. DirectX 12 requires additional work on the part of the game, so in some cases the overhead of this may result in poorer performance compared to the DirectX 11 version. We are still optimizing our DirectX 12 implementation and we expect to see improved performance on additional configurations, but currently DirectX 11 may be the best option for players with less capable systems.

We hope this new version of HITMAN 2 provides a better experience for some players and look forward to hearing your feedback.

The post DirectX 12 boosts performance of HITMAN 2 appeared first on DirectX Developer Blog.

OS Variable Refresh Rate

$
0
0

With Windows Version 1903, we have added a new toggle in Graphics Settings for variable refresh rate. Variable refresh rate (VRR) is similar to NVIDIA’s G-SYNC and VESA DisplayPort Adaptive-Sync.

This new OS support is only to augment these experiences and does not replace them. You should continue to use G-SYNC / Adaptive-Sync normally. This toggle doesn’t override any of the settings you’ve already configured in the G-SYNC or Adaptive-Sync control panels.

This new toggle enables VRR support for DX11 full-screen games that did not support VRR natively, so these games can now benefit from your VRR hardware.

You won’t see the slider unless your system has all of the following. If any of these are missing, you will not see the toggle and the feature will not be enabled for you.

  • Windows Version 1903 or later
  • A G-SYNC or Adaptive-Sync capable monitor
  • A GPU with WDDM 2.6 or above drivers, that supports G-SYNC / Adaptive-Sync and this new OS feature

This feature is disabled by default, but you can turn it on and try the feature out. If you run into any unexpected issues while gaming, turn the feature off and see if that resolves the issue for you.

The post OS Variable Refresh Rate appeared first on DirectX Developer Blog.

Debugger Extension for DRED

$
0
0

Microsoft recently announced the release of DRED (Device Removed Extended Data) for D3D12 in the Windows 10 May 2019 Update (previously referred to as the Windows 10 19H1 Preview).  Buried in that post is a mention that Microsoft is working on a debugger extension to help simplify post-mortem analysis of DRED.  Good news, that debugger extension is now available on GitHub.  D3DDred.js is a JavaScript debugger extension for WinDbg (available here). This extension makes it possible to examine the DRED output with clear context and a human-readable layout.

Why WinDbg? Besides being a powerful, lightweight debugger, WinDbg supports JavaScript extensions.  There is no need to configure build tools or run any installers to use D3DDred.js.  Simply load the script into WinDbg and you are ready to roll.  Using the WinDbg console, type:

.scriptload c:\my-windbg-extensions\d3ddred.js

When a TDR occurs in an app with DRED enabled, the runtime preserves the DRED output in the application memory heap.  Using WinDbg attached to a process or heap dump with D3DDred.js loaded, the DRED output can be trivially observed by running !d3ddred from the WinDbg console.

Example:

The following is an example using a busted version of Microsoft’s D3D12 ModelViewer sample.

0:000> !d3ddred
@$d3ddred()                 : [object Object] [Type: D3D12_DEVICE_REMOVED_EXTENDED_DATA1]
    [<Raw View>]     [Type: D3D12_DEVICE_REMOVED_EXTENDED_DATA1]
    DeviceRemovedReason : 0x887a0006 (The GPU will not respond to more commands, most likely because of an invalid command passed by the calling applicat [Type: HRESULT]
    AutoBreadcrumbNodes : Count: 1
    PageFaultVA      : 0x29b450000
    ExistingAllocations : Count: 0
    RecentFreedAllocations : Count: 2

In this example, there is only one AutoBreadcrumbNode object.  Clicking on AutoBreadcrumbNodes shows:

(*((ModelViewer!D3D12_DEVICE_REMOVED_EXTENDED_DATA1 *)0x7fffee841a08)).AutoBreadcrumbNodes                 : Count: 1
    [0x0]            : 0x1e2ed2dcf58 : [object Object] [Type: D3D12_AUTO_BREADCRUMB_NODE *]

Click [0x0]:

((ModelViewer!D3D12_AUTO_BREADCRUMB_NODE *)0x1e2ed2dcf58) : 0x1e2ed2dcf58                 : [object Object] [Type: D3D12_AUTO_BREADCRUMB_NODE *]
    [<Raw View>]     [Type: D3D12_AUTO_BREADCRUMB_NODE]
    CommandListDebugName : 0x1e2eceb04a0 : "ClearBufferCL" [Type: wchar_t *]
    CommandQueueDebugName : 0x1e2ecead4a0 : "CommandListManager::m_CommandQueue" [Type: wchar_t *]
    NumCompletedAutoBreadcrumbOps : 0x1
    NumAutoBreadcrumbOps : 0x3
    ReverseCompletedOps : [object Object]
    OutstandingOps   : [object Object

This implies that queue “CommandListManager::m_CommandQueue” and command list “ClearBufferCL” contain the likely suspect operation.

The ReverseCompletedOps value is an array (in reverse order) of command list operations that completed without error:

((ModelViewer!D3D12_AUTO_BREADCRUMB_NODE *)0x1e2ed2dcf58)->ReverseCompletedOps                 : [object Object]
    [0x0]            : D3D12_AUTO_BREADCRUMB_OP_CLEARUNORDEREDACCESSVIEW (13) [Type: D3D12_AUTO_BREADCRUMB_OP]

This shows that only one operation completed before faulting.  In this case it was a ClearUnorderedAccessView command.

The OutstandingOps value is an array (in normal forward order) of command list operations that are not guaranteed to have completed without error.

((ModelViewer!D3D12_AUTO_BREADCRUMB_NODE *)0x1e2ed2dcf58)->OutstandingOps                 : [object Object]
    [0x0]            : D3D12_AUTO_BREADCRUMB_OP_COPYRESOURCE (9) [Type: D3D12_AUTO_BREADCRUMB_OP]
    [0x1]            : D3D12_AUTO_BREADCRUMB_OP_RESOURCEBARRIER (15) [Type: D3D12_AUTO_BREADCRUMB_OP]

In most cases, the first outstanding operation is the strongest suspect.  The outstanding CopyResource operation shown here is in fact the culprit.

Notice that PageFaultVA is not zero in the initial !d3ddred output.  This indicates that the GPU faulted due to a read or write error (and that the GPU supports reporting of page faults).  Beneath PageFaultVA is ExistingAllocations and RecentFreedAllocations.  These contain arrays of allocations that match the faulting virtual address.  Since ExistingAllocations is 0, it is not interesting in this case.  However, RecentFreedAllocations has two entries that match the faulting VA:

(*((ModelViewer!D3D12_DEVICE_REMOVED_EXTENDED_DATA1 *)0x7fffee841a08)).RecentFreedAllocations                 : Count: 2
    [0x0]            : 0x1e2e2599120 : [object Object] [Type: D3D12_DRED_ALLOCATION_NODE *]
    [0x1]            : 0x1e2e25990b0 : [object Object] [Type: D3D12_DRED_ALLOCATION_NODE *]

Allocation [0x0] is an internal heap object, and thus is not very interesting.  However, allocation [0x1] reveals:

((ModelViewer!D3D12_DRED_ALLOCATION_NODE *)0x1e2e25990b0)                 : 0x1e2e25990b0 : [object Object] [Type: D3D12_DRED_ALLOCATION_NODE *]
    [<Raw View>]     [Type: D3D12_DRED_ALLOCATION_NODE]
    ObjectName       : 0x1e2ed352730 : "UAVBuffer01" [Type: wchar_t *]
    AllocationType   : D3D12_DRED_ALLOCATION_TYPE_RESOURCE (34) [Type: D3D12_DRED_ALLOCATION_TYPE]

So, a buffer named “UAVBuffer01” that mapped to the faulting VA was recently deleted.

The verdict in this case is that the CopyResource operation on CommandList “ClearBufferCL” tried to access buffer “UAVBuffer01” after it had been deleted.

Symbols:

Unfortunately, the public symbols for D3D12 do not include the type data needed for the D3DDred.js extension (type information is typically stripped from public OS symbols).  Fortunately, D3DDred.js can usually work around this by searching though other loaded modules for the DRED data types.  However, since older SDK’s will not have the DRED types this workaround requires building with the Windows 10 May 2019 SDK.  The good news is this has been addressed in the next OS release, and we are currently working to update the public symbols for May 2019 with the DRED data types.

Enabling DRED:

As of the May 2019 SDK, the most efficient way to enable DRED is by using the DRED API’s.  DRED must be enabled before creating the D3D12 Device.

CComPtr<ID3D12DeviceRemovedExtendedDataSettings> pDredSettings;
if (SUCCEEDED(D3D12GetDebugInterface(IID_PPV_ARGS(&pDredSettings))))
{
    pDredSettings->SetAutoBreadcrumbsEnablement(D3D12_DRED_ENABLEMENT_FORCED_ON);
    pDredSettings->SetPageFaultEnablement(D3D12_DRED_ENABLEMENT_FORCED_ON);
}

Thanks for reading:

If TDR’s are keeping you up at night, you want to use DRED – and you should check out the D3DDred.js debugger extension.  As always, we look forward to your feedback and suggestions.


The post Debugger Extension for DRED appeared first on DirectX Developer Blog.

We’re upgrading to discord!

$
0
0

We’re upgrading the directxtech.com forum to a Discord channel – go to https://discord.gg/kkk2xWc to join today!

We’re going to use our Discord channel in the same way as our directxtech.com forums, which means that game developers will still have a great resource to get their DirectX12 questions answered, file bug reports, and to give us feedback about the things they’d like to see us add to our API.

Why the move?

Developers are increasingly using team chat software, and we’ve gotten consistent feedback from our developer partners that they prefer a more direct, low-latency way to communicate with us. After doing extensive research on the other options that are out there, we found that Discord allows us to best meet developers where they already are.

Moving to Discord is going to make it easier, faster and better for us to help developers and hear what they want to see from our API. We look forward to working with everyone!

Links

On 7/1 we’ll turn directxtech.com into a handy landing page that developers can use to access the following links:


The post We’re upgrading to discord! appeared first on DirectX Developer Blog.


Useful Links

Use VHD to Accelerate DirectX 12 Development

$
0
0

DirectX 12 has been evolving rapidly, with new features and new tools released in each major Windows 10 OS upgrade. We also provide feature preview through the Windows Insider Program to encourage early adoption. For game developers who cannot upgrade their main dev machines frequently to take all those benefits, they can use VHD files to quickly set up a Windows 10 OS on their dev machine without changing the major OS partition.


Sample Scenario

Game developer has a dev machine on Windows 10 October 2018 Update (aka. RS5) but wants to use the latest DRED tool to diagnose GPU faults on the May 2019 Update (aka. 19H1).

  • Graphics developer has a local dev machine, with
    • C Drive: RS5 OS
    • D Drive: Visual studio, game project with all assets and binaries compiled
  • Developer runs the game and hits a TDR
  • Developer copies and sets up a VHDX file (based on 19H1 OS) on the local machine (see instructions below), reboots to the VHDX partition; now there is a new guest OS on the dev machine
    • E Drive: 19H1 OS
  • Developer runs the game with DRED on 19H1 and fixes the problem
  • Developer reboots to the main OS and continues development.


Instruction: How to create a VHDX file

Game developers can download an ISO file then convert it to VHDX. For example,

    1. Sign up for Windows Insider Program, then download ISO images from https://www.microsoft.com/en-us/software-download/windowsinsiderpreviewadvanced
    2. Download the script of “Convert-WindowsImage.ps1” from https://gallery.technet.microsoft.com/scriptcenter/Convert-WindowsImageps1-0fe23a8f; you do need to apply fixes by “cryptonym” on Dec 6 2017 under the Q&A section;
    3. Create a new Powershell script of “ISO2VHDX.ps1”, copy the content below, customize it as needed, then run it to convert the ISO file to VHDX.

. .\Convert-WindowsImage.ps1 

$ConvertWindowsImageParam = @{ 
    SourcePath          = 'F:\VHD\Windows10_19H1.iso' 
    VHDPath             = 'F:\VHD\Windows10_19H1.vhdx'
    RemoteDesktopEnable = $True 
    Passthru            = $True 
    Edition             = "Enterprise"
    VHDFormat           = "VHDX"
    BCDinVHD            = "NativeBoot"
    SizeBytes           = 60GB
    WorkingDirectory    = 'F:\VHD'
    VHDPartitionStyle   = 'GPT'
}

$VHDx = Convert-WindowsImage @ConvertWindowsImageParam


Instruction: How to customize VHDX

Game studio can optionally customize a VHDX file before sharing it among the studio.

  • Resize VHDX
    • If you need extra space in VHDX to install visual studio and other components required to developer, debug, or run your game, (1) Use Resize-VHD in PowerShell to expand VHDX (before you attach the VHDX file); (2) After you set up the VHDX file as bootable (see steps below), run
      diskmgmt.msc
      , right click the newly attached drive, then select “Extent Volume” to take up all unallocated space.
  • Set up VHDX on a host PC (see instructions below), then install extra software for testing and debugging
    • For example, runtime dependency that must be installed on the OS driver; internal tools, etc.


Instruction: How to set up VHDX on host PC

You can manually set up new guest OS on a dev machine using the VHDX file.

  1. Copy a VHDX to a disk partition without Bitlock protection
  2. Run
    diskmgmt.msc
      (Disk Management)
  3. From menu, choose “Action”/”Attach VHD” to attach the VHDX file
  4. Give it a driver letter (if it does not have one after attachment): with the VHDX selected, from menu, “Action”/”All Tasks”/”Change Driver Letter and Paths…”
  5. In an elevated command window, type
    bcdboot n:\windows
      (where n is the VHDX’s driver letter). This will create a boot record for the VHDX and make it the default. It will also copy the right bootloader from the VHDX.
  6. (Optional) Give the new OS a friendly name, by typing
    bcdedit /set {id} DESCRIPTION 19H1
    , where {id} is the boot identifier, and “19H1” is the desired name. Running
    bcdboot n:\windows
    above marks the new record as {default}, so that’s likely what you’d use for {id} if following the steps above
  7. Run
    msconfig
    and on the boot tab set the boot entry that you actually want to be default. You can also delete stale boot entries there.
  8. Reboot and select the new 19H1 OS.


The post Use VHD to Accelerate DirectX 12 Development appeared first on DirectX Developer Blog.

New in D3D12 – Motion Estimation

$
0
0

In the Windows 10 May 2019 Update, codenamed 19H1, D3D12 has added a new Motion Estimation feature to D3D12. Motion estimation is the process of determining motion vectors that describe the transformation from one 2D image to another. Motion estimation is an essential part of video encoding and can be used in frame rate conversion algorithms. Windows Mixed Reality leverages this feature as part of it’s Motion Reprojection feature as of the latest beta release.

While motion estimation can be implemented with shaders, the purpose of the D3D12 Motion Estimation feature is to expose fixed function acceleration for motion searching to offload this part of the work from 3D. Often this comes in the form of exposing the GPU video encoder motion estimator. The goal of D3D12 Motion estimation is optical flow, but it should be noted that encoder motion estimators may be optimized for improving compression.

Checking for Support
To understand the supported block size and resolutions for a given format, use the D3D12_FEATURE_VIDEO_MOTION_ESTIMATOR check with the D3D12_FEATURE_DATA_VIDEO_MOTION_ESTIMATOR struct like the example below. Currently only DXGI_FORMAT_NV12 is supported, so content may need to be color converted and downsampled to use motion estimation:

D3D12_FEATURE_DATA_VIDEO_MOTION_ESTIMATOR MotionEstimatorSupport = {0u, DXGI_FORMAT_NV12};
VERIFY(spVideoDevice->CheckFeatureSupport(D3D12_FEATURE_VIDEO_MOTION_ESTIMATOR, &MotionEstimatorSupport, sizeof(MotionEstimatorSupport)));

The D3D12_FEATURE_DATA_MOTION_ESTIMATOR struct looks like this:

// D3D12_FEATURE_VIDEO_MOTION_ESTIMATOR
typedef struct D3D12_FEATURE_DATA_VIDEO_MOTION_ESTIMATOR
{
    UINT NodeIndex;                                                                 // input
    DXGI_FORMAT InputFormat;                                                        // input
    D3D12_VIDEO_MOTION_ESTIMATOR_SEARCH_BLOCK_SIZE_FLAGS BlockSizeFlags;            // output
    D3D12_VIDEO_MOTION_ESTIMATOR_VECTOR_PRECISION_FLAGS PrecisionFlags;             // output
    D3D12_VIDEO_SIZE_RANGE SizeRange;                                               // output
} D3D12_FEATURE_DATA_VIDEO_MOTION_ESTIMATOR;

Creating the Motion Estimator
The Video Motion Estimator is a driver state object for performing the motion estimation operation. The selected block size, precision, and supported size range would depend on values supported by hardware returned from the D3D12_FEATURE_VIDEO_MOTION_ESTIMATOR feature check. You can select a smaller size range than the driver supports. Size range informs internal allocation sizes.

D3D12_VIDEO_MOTION_ESTIMATOR_DESC motionEstimatorDesc = { 
    0, //NodeIndex
    DXGI_FORMAT_NV12, 
    D3D12_VIDEO_MOTION_ESTIMATOR_SEARCH_BLOCK_SIZE_16X16,
    D3D12_VIDEO_MOTION_ESTIMATOR_VECTOR_PRECISION_QUARTER_PEL, 
    {1920, 1080, 1280, 720} // D3D12_VIDEO_SIZE_RANGE
    }; 

CComPtr<ID3D12VideoMotionEstimator> spVideoMotionEstimator;
VERIFY_SUCCEEDED(spVideoDevice->CreateVideoMotionEstimator(
    &motionEstimatorDesc, 
    nullptr,
    IID_PPV_ARGS(&spVideoMotionEstimator)));

Creating the Motion Vector Output
A Motion Vector Heap is used as a hardware dependent output for motion estimation operations. Then, a resolve operation translates those results into an API defined format in a standard 2D texture. The resolved output 2D texture is a DXGI_FORMAT_R16G16_SINT texture where R holds the horizontal component and G holds the vertical component of the motion vector. This texture is sized to hold one pair of components per block.

D3D12_VIDEO_MOTION_VECTOR_HEAP_DESC MotionVectorHeapDesc = { 
    0, // NodeIndex 
    DXGI_FORMAT_NV12, 
    D3D12_VIDEO_MOTION_ESTIMATOR_SEARCH_BLOCK_SIZE_16X16,
    D3D12_VIDEO_MOTION_ESTIMATOR_VECTOR_PRECISION_QUARTER_PEL, 
    {1920, 1080, 1280, 720} // D3D12_VIDEO_SIZE_RANGE
    }; 

CComPtr<ID3D12VideoMotionVectorHeap> spVideoMotionVectorHeap;
VERIFY_SUCCEEDED(spVideoDevice->CreateVideoMotionVectorHeap(
    &MotionVectorHeapDesc, 
    nullptr, 
    IID_PPV_ARGS(&spVideoMotionVectorHeap)));

CD3DX12_RESOURCE_DESC resolvedMotionVectorDesc =
    CD3DX12_RESOURCE_DESC::Tex2D(
        DXGI_FORMAT_R16G16_SINT, 
        Align(1920, 16) / 16, // This example uses a 16x16 block size. Pixel width and height
        Align(1080, 16) / 16, // are adjusted to store the vectors for those blocks.
        1, // ArraySize
        1  // MipLevels
        );

    ATL::CComPtr< ID3D12Resource > spResolvedMotionVectors;
    VERIFY_SUCCEEDED(pDevice->CreateCommittedResource(
        &Properties,
        D3D12_HEAP_FLAG_NONE,
        &resolvedMotionVectorDesc,
        D3D12_RESOURCE_STATE_COMMON,
        nullptr,
        IID_PPV_ARGS(&spResolvedMotionVectors)));

Performing the Motion Search
The example below executes the motion search and resolves the motion vectors to the 2D texture with D3D12_COMMAND_LIST_TYPE_VIDEO_ENCODE.  D3D12 Resources used as input to Estimate Motion must be in the ENCODE_READ state and the resource written to by ResolveMotionVectorHeap must be in the ENCODE_WRITE state.

const D3D12_VIDEO_MOTION_ESTIMATOR_OUTPUT outputArgs = {spVideoMotionVectorHeap};

const D3D12_VIDEO_MOTION_ESTIMATOR_INPUT inputArgs = {
    spCurrentResource,
    0,
    spReferenceResource,
    0,
    nullptr // pHintMotionVectorHeap
    };

spCommandList->EstimateMotion(spVideoMotionEstimator, &outputArgs, &inputArgs);

const D3D12_RESOLVE_VIDEO_MOTION_VECTOR_HEAP_OUTPUT outputArgs = { 
    spResolvedMotionVectors,
    {}};

const D3D12_RESOLVE_VIDEO_MOTION_VECTOR_HEAP_INPUT inputArgs = {
    spVideoMotionVectorHeap,
    1920,
    1080
    };

spCommandList->ResolveMotionVectorHeap(&outputArgs, &inputArgs);
        
VERIFY(spCommandList->Close());

// Execute Commandlist.
ID3D12CommandList *ppCommandLists[1] = { spCommandList.p };
spCommandQueue->ExecuteCommandLists(1, ppCommandLists);


The post New in D3D12 – Motion Estimation appeared first on DirectX Developer Blog.

Porting DirectX 12 games to Windows 7

$
0
0

We announced “World of Warcraft uses DirectX 12 running on Windows 7” back in March. Since that time, we have received warm welcome from the gaming community, and we continued to work with several game studios to further evaluate this work.

To better support game developers at larger scales, we are publishing the following resources to allow game developers to run their DirectX 12 games on Windows 7. Please post technical question or feedback to our Discord channel at http://discord.gg/directx.

We would like to thank the development community for their help in evolving the DirectX 12 technology, and we have been so excited to work with game developers to bring the benefits of DirectX 12 to all their customers. Please keep the feedback coming!

The post Porting DirectX 12 games to Windows 7 appeared first on DirectX Developer Blog.

D3DConfig: A new tool to manage DirectX Control Panel settings

$
0
0

The DirectX Control Panel (DXCpl.exe) has dutifully given developers the ability to configure Direct3D debug settings for nearly two decades.  But what started as a simple utility for controlling D3D debug output and driver type selection has struggled to keep up with modern DX12 debugging options.  In addition, the UI-based DXCpl doesn’t integrate into automation scripts, nor is it useful on scaled-down Windows platforms that do not support Win32-based user interfaces.

What we need is a command line tool

Introducing D3DConfig.exe in, a console app compatible with DXCpl.  The D3DConfig tool can display and modify the DXCpl settings from the comfort of your very own console window or batch script.  D3DConfig.exe is part of the Graphics Tools Feature-on-Demand and is available in the “20H1” Windows 10 Insider Preview (currently build 18970 in fast-ring).  If you already have Graphics Tools installed (you do if you are using D3D debug layers), then updating to 20H1 will automatically add D3DConfig to your system.  If you have been holding off installing Graphics Tools until you could change D3D settings from the command line, then your time has come.  Graphics Tools can be installed by using Windows 10 “Manage Optional Features” settings, or by running the following command:

> DISM /online /add-capability /capabilityname:tools.graphics.directx~~~~0.0.1.0

You can still use the DirectX Control Panel if you like.  D3DConfig recognizes DXCpl settings.  Similarly, the DXCpl reflects most D3DConfig settings.  At this time we have no plans to expand the DXCpl user interface.  This means that new settings are likely to be exposed only in the D3DConfig tool.  For example, DRED settings are only available in D3DConfig.

Examples

Like DXCpl, only registered apps are affected by the D3DConfig settings.  To list the currently registered apps, run:

> d3dconfig apps

apps
--------------------------------
  foo.exe
  bar.exe

To register an app:

> d3dconfig apps --add MyBuggyGame.exe

apps
--------------------------------
  MyBuggyGame.exe
  foo.exe
  bar.exe

Apps can also be registered using directory scope (yes, the terminating ‘\’ character is needed):

> d3dconfig apps --add g:\bin\games\

apps
--------------------------------
  g:\bin\games\
  MyBuggyGame.exe
  foo.exe
  bar.exe

One of the most common tasks done in DXCpl is to force the debug layer on.  The D3DConfig tool can do that too.

> d3dconfig debug-layer debug-layer-mode=force-on

debug-layer
----------------
debug-layer-mode=force-on

Break-on debug messages can also be controlled using D3DConfig.  In order to remain compatible with the DX Control Panel, this is a two-step process:

> d3dconfig message-break allow-debug-breaks=true

message-break
----------------
allow-debug-breaks=true

> d3dconfig message-break --add-id-12 722

message-break
----------------
Break-On D3D11 Message Ids:
  <none>
Break-On D3D12 Message Ids:
  722: D3D12_MESSAGE_ID_CREATERESOURCE_INVALIDMIPLEVELS

Of course, the –help option provides a full list of available options.

Feedback Requested

If you get a chance to try out D3DConfig let us know that you think.  At the moment, D3DConfig has a very simple design.  There certainly are some interesting bells and whistles we would like to add but customer feedback helps us prioritize our work.


The post D3DConfig: A new tool to manage DirectX Control Panel settings appeared first on DirectX Developer Blog.

Viewing all 291 articles
Browse latest View live


<script src="https://jsc.adskeeper.com/r/s/rssing.com.1596347.js" async> </script>