Quantcast
Channel: DirectX Developer Blog
Viewing all 291 articles
Browse latest View live

DirectML at GDC 2019

$
0
0
Introduction

Last year at GDC, we shared our excitement about the many possibilities for using machine learning in game development. If you’re unfamiliar with machine learning or neural networks, I strongly encourage you to check out our blog post from last year, which is a primer for many of the topics discussed in this post.

This year, we’re furthering our commitment to enable ML in games by making DirectML publicly available for the first time. We continuously engage with our customers and heard the need for a GPU-inferencing API that gives developers more control over their workloads to make integration with rendering engines easier. With DirectML, game developers write code once and their ML scenario works on all DX12-capable GPUs – a hardware agnostic solution at the operator level. We provide the consistency and performance required to integrate innovations in ML into rendering engines.

Additionally, Unity announced plans to support DirectML in their Unity Inference Engine that powers Unity ML Agents. Their decision to adopt DirectML was driven by the available hardware acceleration on Windows platforms while maintaining control of the data locality and the execution flow. By utilizing the regular graphics pipeline, they are saving on GPU stalls and have full integration with the rendering engine. Unity is in the process of integrating DirectML into their inference engine to allow developers to take advantage of metacommands and other optimizations available with DirectML.

A corgi holding a stick in Unity's ML Agents

We are very excited about our collaboration with Unity and the promise this brings to the industry. Providing developers fast inferencing across a broad set of platforms democratizes machine learning in games and improves the industry by proving out that ML can be integrated well with rendering work to enable novel experiences for gamers. With DirectML, we want to ensure that applications run well across all Windows hardware and empower developers to confidently ship machine learning models on lightweight laptops and hardcore gaming rigs alike. From a single model to a custom inference engine, DirectML will give you the most out of your hardware.


Why DirectML

Many new real-time inferencing scenarios have been introduced to the developer community over the last few years through cutting edge machine learning research. Some examples of these are super resolution, denoising, style transfer, game testing, and tools for animation and art. These models are computationally expensive but in many cases are required to run in real-time. DirectML enables these to run with high-performance by providing a wide set of optimized operators without the overhead of traditional inferencing engines.

Examples of operators provided in DirectML


To further enhance performance on the operators that customers need most, we work directly with hardware vendors, like Intel, AMD, and NVIDIA, to directly to provide architecture-specific optimizations, called metacommands. Newer hardware provides advances in ML performance through the use of FP16 precision and designated ML space on chips. DirectML’s metacommands provide vendors a way of exposing those advantages through their drivers to a common interface. Developers save the effort of hand tuning for individual hardware but get the benefits of these innovations.

DirectML is already providing some of these performance advantages by being the underlying foundation of WinML, our high-level inferencing engine that powers applications outside of gaming, like Adobe, Photos, Office, and Intelligent Ink. The API flexes its muscles by enabling applications to run on millions of Windows devices today.


Getting Started

DirectML is available today in the Windows Insider Preview and will be available more broadly in our next release of Windows. To help developers learn this exciting new technology, we provided a few resources below, including samples that show developers how to use DirectML in real-time scenarios and exhibit our recommended best practices.

Documentation: https://docs.microsoft.com/en-us/windows/desktop/direct3d12/dml

Samples: https://github.com/microsoft/DirectML-Samples

If you were unable to attend our GDC talk this year, slides containing more in-depth information about the API and best practices will be available here in the coming days. We will be releasing the super-resolution demo featured in this deck as an open source sample, coming soon. Stay tuned to the GitHub account above.

The post DirectML at GDC 2019 appeared first on DirectX Developer Blog.


New in D3D12 – DirectX Raytracing (DXR) now supports library subobjects

$
0
0

In the next update to Windows, codenamed 19H1, developers can specify DXR state subobjects inside a DXIL library. This provides an easier, flexible, and modular way of defining raytracing state, removing the need for repetitive boilerplate C++ code. This usability improvement was driven by feedback from early adopters of the API, so thanks to all those who took the time to share your experiences with us!

The D3D12RaytracingLibrarySubobjects sample illustrates using library subobjects in an application.

What are library subobjects?

Library subobjects are a way to configure raytracing pipeline state by defining subobjects directly within HLSL shader code. The following subobjects can be compiled from HLSL into a DXIL library:

  • D3D12_STATE_SUBOBJECT_TYPE_STATE_OBJECT_CONFIG
  • D3D12_STATE_SUBOBJECT_TYPE_GLOBAL_ROOT_SIGNATURE
  • D3D12_STATE_SUBOBJECT_TYPE_LOCAL_ROOT_SIGNATURE
  • D3D12_STATE_SUBOBJECT_TYPE_SUBOBJECT_TO_EXPORTS_ASSOCIATION
  • D3D12_STATE_SUBOBJECT_TYPE_RAYTRACING_SHADER_CONFIG
  • D3D12_STATE_SUBOBJECT_TYPE_RAYTRACING_PIPELINE_CONFIG
  • D3D12_STATE_SUBOBJECT_TYPE_HIT_GROUP

A library subobject is identified by a string name, and can be exported from a library or existing collection in a similar fashion to how shaders are exported using D3D12_EXPORT_DESC. Library subobjects also support renaming while exporting from libraries or collections. Renaming can be used to avoid name collisions, and to promote subobject reuse.

This example shows how to define subobjects in HLSL:

GlobalRootSignature MyGlobalRootSignature =
{
    "DescriptorTable(UAV(u0)),"                     // Output texture
    "SRV(t0),"                                      // Acceleration structure
    "CBV(b0),"                                      // Scene constants
    "DescriptorTable(SRV(t1, numDescriptors = 2))"  // Static index and vertex buffers.
};

LocalRootSignature MyLocalRootSignature = 
{
    "RootConstants(num32BitConstants = 4, b1)"  // Cube constants 
};

TriangleHitGroup MyHitGroup =
{
    "",                    // AnyHit
    "MyClosestHitShader",  // ClosestHit
};

ProceduralPrimitiveHitGroup MyProceduralHitGroup
{
    "MyAnyHit",       // AnyHit
    "MyClosestHit",   // ClosestHit
    "MyIntersection"  // Intersection
};

SubobjectToExportsAssociation MyLocalRootSignatureAssociation =
{
    "MyLocalRootSignature",    // Subobject name
    "MyHitGroup;MyMissShader"  // Exports association 
};

RaytracingShaderConfig MyShaderConfig =
{
    16,  // Max payload size
    8    // Max attribute size
};

RaytracingPipelineConfig MyPipelineConfig =
{
    1  // Max trace recursion depth
};

StateObjectConfig MyStateObjectConfig = 
{ 
    STATE_OBJECT_FLAGS_ALLOW_LOCAL_DEPENDENCIES_ON_EXTERNAL_DEFINITONS
};

Note that the subobject names used in an association subobject need not be defined within the same library or even collection, and can be imported from different libraries within same collection or a different collection altogether. In cases where a subobject definition is used from a different collection, the collection that provides the subobject definitions must use the state object config flag D3D12_STATE_OBJECT_FLAG_ALLOW_EXTERNAL_DEPENDENCIES_ON_LOCAL_DEFINITIONS, and the collection which depends on the external definitions of the subobject must specify the config flag D3D12_STATE_OBJECT_FLAG_ALLOW_LOCAL_DEPENDENCIES_ON_EXTERNAL_DEFINITIONS.

Subobject associations at library scope

(this section is included for completeness: most readers can probably ignore these details)

Library subobjects follow rules for default associations. An associable subobject (config or root signature subobject) becomes a candidate for implicit default association if it is the only subobject of its type defined in the library, and if it is not explicitly associated to any shader export. Use of default associable subobject can be explicitly specified by giving an empty list of shader exports in the SubobjectToExportsAssociation definition. Note that the scope of the defaults only applies to the shaders defined in the library. Also note that similar to non-explicit associations, the associable subobjects names specified in SubobjectToExportsAssociation need not be defined in the same library, and this definition can come from a different library or even different collection.

Subobject associations (i.e. config and root signature association between subobjects and shaders) defined at library scope have lower priority than the ones defined at collection or state object scope. This includes all explicit and default associations. For example, an explicit config or root signature association to a hit group defined at library scope can be overridden by an implicit default association at state object scope.

Subobject associations can be elevated to state object scope by using a SubobjectToExportsAssociation subobject at state object scope. This association will have equal priority to other state object scope associations, and the D3D12 runtime will report errors if multiple inconsistent associations are found for a given shader.

Creating Root Signatures from DXIL library bytecode

In DXR, if an application wants to use a global root signature in a DispatchRays() call then it must first bind the global root signature to the command list via SetComputeRootSignature(). For DXIL-defined global root signatures, the application must call SetComputeRootSignature() with an ID3D12RootSignature* that matches the DXIL-defined global root signature. To make this easier for developers, the D3D12 CreateRootSignature API has been updated to accept DXIL library bytecode and will create a root signature from the global root signature subobject defined in that DXIL library. The requirement here is that there should be only one global root signature defined in the DXIL library. The runtime and debug layer will report an error if this API is used with library bytecode having none or multiple global root signatures.

Similarly, the APIs D3D12CreateRootSignatureDeserializer and D3D12CreateVersionedRootSignatureDeserializer are updated to create root signature deserializers from library bytecode that defines one global root signature subobject.

Requirements

Windows SDK version 18282 or higher is required for the DXC compiler update. OS version 18290 or higher is needed for runtime and debug layer binaries. Both are available today through the Windows Insider Program. PIX supports library subobjects as of version 1901.28. This feature does not require a driver update.

The post New in D3D12 – DirectX Raytracing (DXR) now supports library subobjects appeared first on DirectX Developer Blog.

New in D3D12 – GPU-Based Validation (GBV) is now available for Shader Model 6.x

$
0
0

In the next update to Windows, codenamed 19H1, the DirectX12 debug layer adds support for GPU-based validation (GBV) of shader model 6.x (DXIL) as well as the previously supported shader model 5.x (DXBC).

GBV is a GPU timeline validation that modifies and injects validation instructions directly into application shaders. It can provide more detailed validation than is possible using CPU validation alone. In previous Windows releases, GBV modified DXBC shaders to provide validations such as resource state tracking, out-of-bound buffer accesses, uninitialized resource and descriptor bindings, and resource promotion/decay validation. With the 19H1 release, the debug layer provides all these validations for DXIL based shaders as well.

This support is available today in the latest 19H1 builds accessible through the Windows Insider Program.

How to enable GPU-based validation for applications using DXIL shaders

No additional step is needed to enable DXIL GBV. The traditional method is extended to support DXIL based shader patching as well as DXBC:

void EnableShaderBasedValidation()
{
    CComPtr<ID3D12Debug> spDebugController0;
    CComPtr<ID3D12Debug1> spDebugController1;

    VERIFY(D3D12GetDebugInterface(IID_PPV_ARGS(&spDebugController0)));
    VERIFY(spDebugController0->QueryInterface(IID_PPV_ARGS(&spDebugController1)));
    spDebugController1->SetEnableGPUBasedValidation(true);
}

The post New in D3D12 – GPU-Based Validation (GBV) is now available for Shader Model 6.x appeared first on DirectX Developer Blog.

DirectX engineering specs published

$
0
0

Engineering specs for a number of DirectX features, including DirectX Raytracing, Variable Rate Shading, and all of D3D11, are now available at https://microsoft.github.io/DirectX-Specs. This supplements the official API documentation with an extra level of detail that can be useful to expert developers.

The specs are licensed under Creative Commons. We welcome contributions to clarify, add missing detail, or better organize the material.

The post DirectX engineering specs published appeared first on DirectX Developer Blog.

New in D3D12 – background shader optimizations

$
0
0

tl;dr;

In the next update to Windows, codenamed 19H1, D3D12 will allow drivers to use idle priority background CPU threads to dynamically recompile shader programs. This can improve GPU performance by specializing shader code to better match details of the hardware it is running on and/or the context in which it is being used. Developers don’t have to do anything to benefit from this feature – as drivers start to use it, existing shaders will automatically be tuned more efficiently. But developers who are profiling their code may wish to use the new SetBackgroundProcessingMode API to control how and when these optimizations take place.

How shader compilation is changing

Creating a D3D12 pipeline state object is a synchronous operation. The API call does not return until all shaders have been fully compiled into ready-to-execute GPU instructions. This approach is simple, provides deterministic performance, and gives sophisticated applications control over things like compiling shaders ahead of time or compiling several in parallel on different threads, but in other ways it is quite limiting.

Most D3D11 drivers, on the other hand, implement shader creation by automatically offloading compilation to a worker thread. This is transparent to the caller, and works well as long as the compilation has finished by the time the shader is needed. A sophisticated driver might do things like compiling the shader once quickly with minimal optimization so as to be ready for use as soon as possible, and then again using a lower priority thread with more aggressive (and hence time consuming) optimizations. Or the implementation might monitor how a shader is used, and over time recompile different versions of it, each one specialized to boost performance in a different situation. This kind of technique can improve GPU performance, but the lack of developer control isn’t ideal. It can be hard to schedule GPU work appropriately when you don’t know for sure when each shader is ready to use, and profiling gets tricky when drivers can swap the shader out from under you at any time! If you measure 10 times and get 10 different results, how can you be sure whether the change you are trying to measure was an improvement or not?

In the 19H1 update to Windows, D3D12 is adding support for background shader recompilation. Pipeline state creation remains synchronous, so (unlike with D3D11) you always know for sure exactly when a shader is ready to start rendering. But now, after the initial state object creation, drivers can submit background recompilation requests at any time. These run at idle thread priority so as not to interfere with the foreground application, and can be used to implement the same kinds of dynamic optimization that were possible with the D3D11 design. At the same time, we are adding an API to control this behavior during profiling, so D3D12 developers will still be able to measure just once and get one reliable result.

How to use it

  1. Have recent build of Windows 19H1 (as of this writing, available through the Windows Insider Program)
  2. Have a driver that implements this feature
  3. That’s it, you’re done!

Surely there’s more to it?

Well ok. While profiling, you probably want to use SetBackgroundProcessingMode to make sure these dynamic optimizations get applied before you take timing measurements. For example:

SetBackgroundProcessingMode(
    D3D12_BACKGROUND_PROCESSING_MODE_ALLOW_INTRUSIVE_MEASUREMENTS,
    D3D_MEASUREMENTS_ACTION_KEEP_ALL,
    null, null);

// prime the system by rendering some typical content, e.g. a level flythrough

SetBackgroundProcessingMode(
    D3D12_BACKGROUND_PROCESSING_MODE_ALLOWED,
    D3D12_MEASUREMENTS_ACTION_COMMIT_RESULTS,
    null, null);

// continue rendering, now with dynamic optimizations applied, and take your measurements

API details

Dynamic optimization state is controlled by a single new API:

HRESULT ID3D12Device6::SetBackgroundProcessingMode(D3D12_BACKGROUND_PROCESSING_MODE Mode,
                                                   D3D12_MEASUREMENTS_ACTION MeasurementsAction,
                                                   HANDLE hEventToSignalUponCompletion,
                                                   _Out_opt_ BOOL* FurtherMeasurementsDesired);

enum D3D12_BACKGROUND_PROCESSING_MODE
{
    D3D12_BACKGROUND_PROCESSING_MODE_ALLOWED,
    D3D12_BACKGROUND_PROCESSING_MODE_ALLOW_INTRUSIVE_MEASUREMENTS,
    D3D12_BACKGROUND_PROCESSING_MODE_DISABLE_BACKGROUND_WORK,
    D3D12_BACKGROUND_PROCESSING_MODE_DISABLE_PROFILING_BY_SYSTEM,
};

enum D3D12_MEASUREMENTS_ACTION
{
    D3D12_MEASUREMENTS_ACTION_KEEP_ALL,
    D3D12_MEASUREMENTS_ACTION_COMMIT_RESULTS,
    D3D12_MEASUREMENTS_ACTION_COMMIT_RESULTS_HIGH_PRIORITY,
    D3D12_MEASUREMENTS_ACTION_DISCARD_PREVIOUS,
};

The BACKGROUND_PROCESSING_MODE setting controls what level of dynamic optimization will apply to GPU work that is submitted in the future:

  • ALLOWED is the default setting. The driver may instrument workloads and dynamically recompile shaders in a low overhead, non-intrusive manner which avoids glitching the foreground workload.
  • ALLOW_INTRUSIVE_MEASUREMENTS indicates that the driver may instrument as aggressively as possible. Causing glitches is fine while in this mode, because the current work is being submitted specifically to train the system.
  • DISABLE_BACKGROUND_WORK means stop it! No background shader recompiles that chew up CPU cycles, please.
  • DISABLE_PROFILING_BY_SYSTEM means no, seriously, stop it for real! I’m doing an A/B performance comparison, and need the driver not to change ANYTHING that could mess up my results.

MEASUREMENTS_ACTION, on the other hand, indicates what should be done with the results of earlier workload instrumentation:

  • KEEP_ALL – nothing to see here, just carry on as you are.
  • COMMIT_RESULTS indicates that whatever the driver has measured so far is all the data it is ever going to see, so it should stop waiting for more and go ahead compiling optimized shaders. hEventToSignalUponCompletion will be signaled when all resulting compilations have finished.
  • COMMIT_RESULTS_HIGH_PRIORITY is like COMMIT_RESULTS, but also indicates the app does not care about glitches, so the runtime should ignore the usual idle priority rules and go ahead using as many threads as possible to get shader recompiles done fast.
  • DISCARD_PREVIOUS requests to reset the optimization state, hinting that whatever has previously been measured no longer applies.

Note that the DISABLE_BACKGROUND_WORK, DISABLE_PROFILING_BY_SYSTEM, and COMMIT_RESULTS_HIGH_PRIORITY options are only available in developer mode.

What about PIX?

PIX will automatically use SetBackgroundProcessingMode, first to prime the system and then to prevent any further changes from taking place in the middle of its analysis. It will wait on an event to make sure all background shader recompiles have finished before it starts taking measurements.

Since this will be handled automatically by PIX, the detail is only relevant if you’re building a similar tool of your own:

BOOL wantMoreProfiling = true;
int tries = 0;

while (wantMoreProfiling && ++tries < MaxPassesInCaseDriverDoesntConverge)
{
    SetBackgroundProcessingMode(
        D3D12_BACKGROUND_PROCESSING_MODE_ALLOW_INTRUSIVE_MEASUREMENTS,
        (tries == 0) ? D3D12_MEASUREMENTS_ACTION_DISCARD_PREVIOUS : D3D12_MEASUREMENTS_ACTION_KEEP_ALL,
        null, null);

    // play back the frame that is being analyzed

    SetBackgroundProcessingMode(
        D3D12_BACKGROUND_PROCESSING_MODE_DISABLE_PROFILING_BY_SYSTEM,
        D3D12_MEASUREMENTS_ACTION_COMMIT_RESULTS_HIGH_PRIORITY,
        handle,
        &wantMoreProfiling);

    WaitForSingleObject(handle);
}

// play back the frame 1+ more times while collecting timing data,
// recording GPU counters, doing A/B perf comparisons, etc.

The post New in D3D12 – background shader optimizations appeared first on DirectX Developer Blog.

GPUs in the task manager

$
0
0

The below posting is from Steve Pronovost, our lead engineer responsible for the GPU scheduler and memory manager.

GPUs in the Task Manager

We're excited to introduce support for GPU performance data in the Task Manager. This is one of the features you have often requested, and we listened. The GPU is finally making its debut in this venerable performance tool.  To see this feature right away, you can join the Windows Insider Program. Or, you can wait for the Windows Fall Creator's Update.

To understand all the GPU performance data, its helpful to know how Windows uses a GPUs. This blog dives into these details and explains how the Task Manager's GPU performance data comes alive. This blog is going to be a bit long, but we hope you enjoy it nonetheless.

System Requirements

In Windows, the GPU is exposed through the Windows Display Driver Model (WDDM). At the heart of WDDM is the Graphics Kernel, which is responsible for abstracting, managing, and sharing the GPU among all running processes (each application has one or more processes). The Graphics Kernel includes a GPU scheduler (VidSch) as well as a video memory manager (VidMm). VidSch is responsible for scheduling the various engines of the GPU to processes wanting to use them and to arbitrate and prioritize access among them. VidMm is responsible for managing all memory used by the GPU, including both VRAM (the memory on your graphics card) as well as pages of main DRAM (system memory) directly accessed by the GPU. An instance of VidMm and VidSch is instantiated for each GPU in your system.

The data in the Task Manager is gathered directly from VidSch and VidMm. As such, performance data for the GPU is available no matter what API is being used, whether it be Microsoft DirectX API, OpenGL, OpenCL, Vulkan or even proprietary API such as AMD's Mantle or Nvidia's CUDA.  Further, because VidMm and VidSch are the actual agents making decisions about using GPU resources, the data in the Task Manager will be more accurate than many other utilities, which often do their best to make intelligent guesses since they do not have access to the actual data.

The Task Manager's GPU performance data requires a GPU driver that supports WDDM version 2.0 or above. WDDMv2 was introduced with the original release of Windows 10 and is supported by roughly 70% of the Windows 10 population. If you are unsure of the WDDM version your GPU driver is using, you may use the dxdiag utility that ships as part of windows to find out. To launch dxdiag open the start menu and simply type dxdiag.exe. Look under the Display tab, in the Drivers section for the Driver Model. Unfortunately, if you are running on an older WDDMv1.x GPU, the Task Manager will not be displaying GPU data for you.

Performance Tab

Under the Performance tab you'll find performance data, aggregated across all processes, for all of your WDDMv2 capable GPUs.

GPUs and Links

On the left panel, you'll see the list of GPUs in your system. The GPU # is a Task Manager concept and used in other parts of the Task Manager UI to reference specific GPU in a concise way. So instead of having to say Intel(R) HD Graphics 530 to reference the Intel GPU in the above screenshot, we can simply say GPU 0. When multiple GPUs are present, they are ordered by their physical location (PCI bus/device/function).

Windows supports linking multiple GPUs together to create a larger and more powerful logical GPU. Linked GPUs share a single instance of VidMm and VidSch, and as a result, can cooperate very closely, including reading and writing to each other's VRAM. You'll probably be more familiar with our partners' commercial name for linking, namely Nvidia SLI and AMD Crossfire. When GPUs are linked together, the Task Manager will assign a Link # for each link and identify the GPUs which are part of it. Task Manager lets you inspect the state of each physical GPU in a link allowing you to observe how well your game is taking advantage of each GPU.

GPU Utilization

At the top of the right panel you'll find utilization information about the various GPU engines.

A GPU engine represents an independent unit of silicon on the GPU that can be scheduled and can operate in parallel with one another. For example, a copy engine may be used to transfer data around while a 3D engine is used for 3D rendering. While the 3D engine can also be used to move data around, simple data transfers can be offloaded to the copy engine, allowing the 3D engine to work on more complex tasks, improving overall performance. In this case both the copy engine and the 3D engine would operate in parallel.

VidSch is responsible for arbitrating, prioritizing and scheduling each of these GPU engines across the various processes wanting to use them.

It's important to distinguish GPU engines from GPU cores. GPU engines are made up of GPU cores. The 3D engine, for instance, might have 1000s of cores, but these cores are grouped together in an entity called an engine and are scheduled as a group. When a process gets a time slice of an engine, it gets to use all of that engine's underlying cores.

Some GPUs support multiple engines mapping to the same underlying set of cores. While these engines can also be scheduled in parallel, they end up sharing the underlying cores. This is conceptually similar to hyper-threading on the CPU. For example, a 3D engine and a compute engine may in fact be relying on the same set of unified cores. In such a scenario, the cores are either spatially or temporally partitioned between engines when executing.

The figure below illustrates engines and cores of a hypothetical GPU.

By default, the Task Manager will pick 4 engines to be displayed. The Task Manager will pick the engines it thinks are the most interesting. However, you can decide which engine you want to observe by clicking on the engine name and choosing another one from the list of engines exposed by the GPU.

The number of engines and the use of these engines will vary between GPUs. A GPU driver may decide to decode a particular media clip using the video decode engine while another clip, using a different video format, might rely on the compute engine or even a combination of multiple engines. Using the new Task Manager, you can run a workload on the GPU then observe which engines gets to process it.

In the left pane under the GPU name and at the bottom of the right pane, you'll notice an aggregated utilization percentage for the GPU. Here we had a few different choices on how we could aggregate utilization across engines. The average utilization across engines felt misleading since a GPU with 10 engines, for example, running a game fully saturating the 3D engine, would have aggregated to a 10% overall utilization! This is definitely not what gamers want to see. We could also have picked the 3D Engine to represent the GPU as a whole since it is typically the most prominent and used engine, but this could also have misled users. For example, playing a video under some circumstances may not use the 3D engine at all in which case the aggregated utilization on the GPU would have been reported as 0% while the video is playing! Instead we opted to pick the percentage utilization of the busiest engine as a representative of the overall GPU usage.

Video Memory

Below the engines graphs are the video memory utilization graphs and summary. Video memory is broken into two big categories: dedicated and shared.

Dedicated memory represents memory that is exclusively reserved for use by the GPU and is managed by VidMm. On discrete GPUs this is your VRAM, the memory that sits on your graphics card.   On integrated GPUs, this is the amount of system memory that is reserved for graphics. Many integrated GPU avoid reserving memory for exclusive graphics use and instead opt to rely purely on memory shared with the CPU which is more efficient.

This small amount of driver reserved memory is represented by the Hardware Reserved Memory.

For integrated GPUs, it's more complicated. Some integrated GPUs will have dedicated memory while others won't. Some integrated GPUs reserve memory in the firmware (or during driver initialization) from main DRAM. Although this memory is allocated from DRAM shared with the CPU, it is taken away from Windows and out of the control of the Windows memory manager (Mm) and managed exclusively by VidMm. This type of reservation is typically discouraged in favor of shared memory which is more flexible, but some GPUs currently need it.

The amount of dedicated memory under the performance tab represents the number of bytes currently consumed across all processes, unlike many existing utilities which show the memory requested by a process.

Shared memory represents normal system memory that can be used by either the GPU or the CPU. This memory is flexible and can be used in either way, and can even switch back and forth as needed by the user workload. Both discrete and integrated GPUs can make use of shared memory.

Windows has a policy whereby the GPU is only allowed to use half of physical memory at any given instant. This is to ensure that the rest of the system has enough memory to continue operating properly. On a 16GB system the GPU is allowed to use up to 8GB of that DRAM at any instant. It is possible for applications to allocate much more video memory than this.  As a matter of fact, video memory is fully virtualized on Windows and is only limited by the total system commit limit (i.e. total DRAM installed + size of the page file on disk). VidMm will ensure that the GPU doesn't go over its half of DRAM budget by locking and releasing DRAM pages dynamically. Similarly, when surfaces aren't in use, VidMm will release memory pages back to Mm over time, such that they may be repurposed if necessary. The amount of shared memory consumed under the performance tab essentially represents the amount of such shared system memory the GPU is currently consuming against this limit.

Processes Tab

Under the process tab you'll find an aggregated summary of GPU utilization broken down by processes.

It's worth discussing how the aggregation works in this view. As we've seen previously, a PC can have multiple GPUs and each of these GPU will typically have several engines. Adding a column for each GPU and engine combinations would leads to dozens of new columns on typical PC making the view unwieldy. The performance tab is meant to give a user a quick and simple glance at how his system resources are being utilized across the various running processes so we wanted to keep it clean and simple, while still providing useful information about the GPU.

The solution we decided to go with is to display the utilization of the busiest engine, across all GPUs, for that process as representing its overall GPU utilization. But if that's all we did, things would still have been confusing. One application might be saturating the 3D engine at 100% while another saturates the video engine at 100%. In this case, both applications would have reported an overall utilization of 100%, which would have been confusing. To address this problem, we added a second column, which indicates which GPU and Engine combination the utilization being shown corresponds to. We would like to hear what you think about this design choice.

Similarly, the utilization summary at the top of the column is the maximum of the utilization across all GPUs. The calculation here is the same as the overall GPU utilization displayed under the performance tab.

Details Tab

Under the details tab there is no information about the GPU by default. But you can right-click on the column header, choose "Select columns", and add either GPU utilization counters (the same one as described above) or video memory usage counters.

There are a few things that are important to note about these video memory usage counters. The counters represent the total amount of dedicated and shared video memory currently in used by that process. This includes both private memory (i.e. memory that is used exclusively by that process) as well as cross-process shared memory (i.e. memory that is shared with other processes not to be confused with memory shared between the CPU and the GPU).

As a result of this, adding the memory utilized by each individual process will sum up to an amount of memory larger than that utilized by the GPU since memory shared across processes will be counted multiple times. The per process breakdown is useful to understand how much video memory a particular process is currently using, but to understand how much overall memory is used by a GPU, one should look under the performance tab for a summation that properly takes into account shared memory.

Another interesting consequence of this is that some system processes, in particular dwm.exe and csrss.exe, that share a lot of memory with other processes will appear much larger than they really are. For example, when an application creates a top level window, video memory will be allocated to hold the content of that window. That video memory surface is created by csrss.exe on behalf of the application, possibly mapped into the application process itself and shared with the desktop window manager (dwm.exe) such that the window can be composed onto the desktop. The video memory is allocated only once but is accessible from possibly all three processes and appears against their individual memory utilization. Similarly, application DirectX swapchain or DCOMP visual (XAML) are shared with the desktop compositor. Most of the video memory appearing against these two processes is really the result of an application creating something that is shared with them as they by themselves allocate very little. This is also why you will see these grow as your desktop gets busy, but keep in mind that they aren't really consuming up all of your resources.

We could have decided to show a per process private memory breakdown instead and ignore shared memory. However, this would have made many applications looks much smaller than they really are since we make significant use of shared memory in Windows. In particular, with universal applications it's typical for an application to have a complex visual tree that is entirely shared with the desktop compositor as this allows the compositor a smarter and more efficient way of rendering the application only when needed and results in overall better performance for the system. We didn't think that hiding shared memory was the right answer. We could also have opted to show private+shared for regular processes but only private for csrss.exe and dwm.exe, but that also felt like hiding useful information to power users.

This added complexity is one of the reason we don't display this information in the default view and reserve this for power users who will know how to find it. In the end, we decided to go with transparency and went with a breakdown that includes both private and cross-process shared memory. This is an area we're particularly interested in feedback and are looking forward to hearing your thoughts.

Closing thought

We hope you found this information useful and that it will help you get the most out of the new Task Manager GPU performance data.

Rest assured that the team behind this work will be closely monitoring your constructive feedback and suggestions so keep them coming! The best way to provide feedback is through the Feedback Hub. To launch the Feedback Hub use our keyboard shortcut Windows key + f. Submit your feedback (and send us upvotes) under the category Desktop Environment -> Task Manager.

Announcing new DirectX 12 features

$
0
0

Announcing new DirectX 12 features

We’ve come a long way since we launched DirectX 12 with Windows 10 on July 29, 2015. Since then, we’ve heard every bit of feedback and improved the API to enhance stability and offer more versatility. Today, developers using DirectX 12 can build games that have better graphics, run faster and that are more stable than ever before. Many games now run on the latest version of our groundbreaking API and we’re confident that even more anticipated, high-end AAA titles will take advantage of DirectX 12.

DirectX 12 is ideal for powering the games that run on PC and Xbox, which as of yesterday is the most powerful console on the market. Simply put, our consoles work best with our software: DirectX 12 is perfectly suited for native 4K games on the Xbox One X.

In the Fall Creator’s Update, we’ve added features that make it easier for developers to debug their code. In this article, we’ll explore how these features work and offer a recap of what we added in Spring Creator’s Update.

But first, let’s cover how debugging a game or a program utilizing the GPU is different from debugging other programs.

As covered previously, DirectX 12 offers developers unprecedented low-level access to the GPU (check out Matt Sandy’s detailed post for more info). But even though this enables developers to write code that’s substantially faster and more efficient, this comes at a cost: the API is more complicated, which means that there are more opportunities for mistakes.

Many of these mistakes happen GPU-side, which means they are a lot more difficult to fix. When the GPU crashes, it can be difficult to determine exactly what went wrong. After a crash, we’re often left with little information besides a cryptic error message. The reason why these error messages can be vague is because of the inherent differences between CPUs and GPUs. Readers familiar with how GPUs work should feel free to skip the next section.

The CPU-GPU Divide

Most of the processing that happens in your machine happens in the CPU, as it’s a component that’s designed to resolve almost any computation it it’s given. It does many things, and for some operations, foregoes efficiency for versatility. This is the entire reason that GPUs exist: to perform better than the CPU at the kinds of calculations that power the graphically intensive applications of today. Basically, rendering calculations (i.e. the math behind generating images from 2D or 3D objects) are small and many: performing them in parallel makes a lot more sense than doing them consecutively. The GPU excels at these kinds of calculations. This is why game logic, which often involves long, varied and complicated computations, happens on the CPU, while the rendering happens GPU-side.

Even though applications run on the CPU, many modern-day applications require a lot of GPU support. These applications send instructions to the GPU, and then receive processed work back. For example, an application that uses 3D graphics will tell the GPU the positions of every object that needs to be drawn. The GPU will then move each object to its correct position in the 3D world, taking into account things like lighting conditions and the position of the camera, and then does the math to work out what all of this should look like from the perspective of the user. The GPU then sends back the image that should be displayed on system’s monitor.

To the left, we see a camera, three objects and a light source in Unity, a game development engine. To the right, we see how the GPU renders these 3-dimensional objects onto a 2-dimensional screen, given the camera position and light source. 

For high-end games with thousands of objects in every scene, this process of turning complicated 3-dimensional scenes into 2-dimensional images happens at least 60 times a second and would be impossible to do using the CPU alone!

Because of hardware differences, the CPU can’t talk to the GPU directly: when GPU work needs to be done, CPU-side orders need to be translated into native machine instructions that our system’s GPU can understand. This work is done by hardwire drivers, but because each GPU model is different, this means that the instructions delivered by each driver is different! Don’t worry though, here at Microsoft, we devote a substantial amount of time to make sure that GPU manufacturers (AMD, Nvidia and Intel) provide drivers that DirectX can communicate with across devices. This is one of the things that our API does; we can see DirectX as the software layer between the CPU and GPU hardware drivers.

Device Removed Errors

When games run error-free, DirectX simply sends orders (commands) from the CPU via hardware drivers to the GPU. The GPU then sends processed images back. After commands are translated and sent to the GPU, the CPU cannot track them anymore, which means that when the GPU crashes, it’s really difficult to find out what happened. Finding out which command caused it to crash used to be almost impossible, but we’re in the process of changing this, with two awesome new features that will help developers figure out what exactly happened when things go wrong in their programs.

One kind of error happens when the GPU becomes temporarily unavailable to the application, known as device removed or device lost errors. Most of these errors happen when a driver update occurs in the middle of a game. But sometimes, these errors happen because of mistakes in the programming of the game itself. Once the device has been logically removed, communication between the GPU and the application is terminated and access to GPU data is lost.

Improved Debugging: Data

During the rendering process, the GPU writes to and reads from data structures called resources. Because it takes time to do translation work between the CPU and GPU, if we already know that the GPU is going to use the same data repeatedly, we might as well just put that data straight into the GPU. In a racing game, a developer will likely want to do this for all the cars, and the track that they’re going to be racing on. All this data will then be put into resources. To draw just a single frame, the GPU will write to and read from many thousands of resources.

Before the Fall Creator’s Update, applications had no direct control over the underlying resource memory. However, there are rare but important cases where applications may need to access resource memory contents, such as right after device removed errors.

We’ve implemented a tool that does exactly this. Developers with access to the contents of resource memory now have substantially more useful information to help them determine exactly where an error occurred. Developers can now optimize time spent trying to determine the causes of errors, offering them more time to fix them across systems.

For technical details, see the OpenExistingHeapFromAddress documentation.

Improved Debugging: Commands

We’ve implemented another tool to be used alongside the previous one. Essentially, it can be used to create markers that record which commands sent from the CPU have already been executed and which ones are in the process of executing. Right after a crash, even a device removed crash, this information remains behind, which means we can quickly figure out which commands might have caused it—information that can significantly reduce the time needed for game development and bug fixing.

For technical details, see the WriteBufferImmediate documentation.

What does this mean for gamers? Having these tools offers direct ways to detect and inform around the root causes of what’s going on inside your machine. It's like the difference between trying to figure out what’s wrong with your pickup truck based on hot smoke coming from the front versus having your Tesla’s internal computer system telling you exactly which part failed and needs to be replaced.

Developers using these tools will have more time to build high-performance, reliable games instead of continuously searching for the root causes of a particular bug.

Recap of Spring Creator’s Update

In the Spring Creator’s Update, we introduced two new features: Depth Bounds Testing and Programmable MSAA. Where the features we rolled out for the Fall Creator’s Update were mainly for making it easier for developers to fix crashes, Depth Bounds Testing and Programmable MSAA are focused on making it easier to program games that run faster with better visuals. These features can be seen as additional tools that have been added to a DirectX developer’s already extensive tool belt.

Depth Bounds Testing

Assigning depth values to pixels is a technique with a variety of applications: once we know how far away pixels are from a camera, we can throw away the ones too close or too far away. The same can be done to figure out which pixels fall inside and outside a light’s influence (in a 3D environment), which means that we can darken and lighten parts of the scene accordingly. We can also assign depth values to pixels to help us figure out where shadows are. These are only some of the applications of assigning depth values to pixels; it’s a versatile technique!

We now enable developers to specify a pixel’s minimum and maximum depth value; pixels outside of this range get discarded. Because doing this is now an integral part of the API and because the API is closer to the hardware than any software written on top of it, discarding pixels that don’t meet depth requirements is now something that can happen faster and more efficiently than before.

Simply put, developers will now be able to make better use of depth values in their code and can free GPU resources to perform other tasks on pixels or parts of the image that aren’t going to be thrown away.

Now that developers have another tool at their disposal, for gamers, this means that games will be able to do more for every scene.

For technical details, see the OMSetDepthBounds documentation.

Programmable MSAA

Before we explore this feature, let’s first discuss anti-aliasing.

Aliasing refers to the unwanted distortions that happen during the rendering of a scene in a game. There are two kinds of aliasing that happen in games: spatial and temporal.

Spatial aliasing refers to the visual distortions that happen when an image is represented digitally. Because pixels in a monitor/television screen are not infinitely small, there isn’t a way of representing lines that aren’t perfectly vertical or horizontal on a monitor. This means that most lines, instead of being straight lines on our screen, are not straight but rather approximations of straight lines. Sometimes the illusion of straight lines is broken: this may appear as stair-like rough edges, or ‘jaggies’, and spatial anti-aliasing refers to the techniques that programmers use to make these kinds edges smoother and less noticeable. The solution to these distortions is baked into the API, with hardware-accelerated MSAA (Multi-Sample Anti-Aliasing), an efficient anti-aliasing technique that combines quality with speed. Before the Spring Creator’s Update, developers already had the tools to enable MSAA and specify its granularity (the amount of anti-aliasing done per scene) with DirectX.

Side-by-side comparison of the same scene with spatial aliasing (left) and without (right). Notice in particular the jagged outlines of the building and sides of the road in the aliased image. This still was taken from Forza Motorsport 6: Apex.

But what about temporal aliasing? Temporal aliasing refers to the aliasing that happens over time and is caused by the sampling rate (or number of frames drawn a second) being slower than the movement that happens in scene. To the user, things in the scene jump around instead of moving smoothly. This YouTube video does an excellent job showing what temporal aliasing looks like in a game.

In the Spring Creator’s Update, we offer developers more control of MSAA, by making it a lot more programmable. At each frame, developers can specify how MSAA works on a sub-pixel level. By alternating MSAA on each frame, the effects of temporal aliasing become significantly less noticeable.

Programmable MSAA means that developers have a useful tool in their belt. Our API not only has native spatial anti-aliasing but now also has a feature that makes temporal anti-aliasing a lot easier. With DirectX 12 on Windows 10, PC gamers can expect upcoming games to look better than before.

For technical details, see the SetSamplePositions documentation.

Other Changes

Besides several bugfixes, we’ve also updated our graphics debugging software, PIX, every month to help developers optimize their games. Check out the PIX blog for more details.

Once again, we appreciate the feedback shared on DirectX 12 to date, and look forward to delivering even more tools, enhancements and support in the future.

Happy developing and gaming!

Announcing Microsoft DirectX Raytracing!

$
0
0

If you just want to see what DirectX Raytracing can do for gaming, check out the videos from Epic, Futuremark and EA, SEED.  To learn about the magic behind the curtain, keep reading.

3D Graphics is a Lie

For the last thirty years, almost all games have used the same general technique—rasterization—to render images on screen.  While the internal representation of the game world is maintained as three dimensions, rasterization ultimately operates in two dimensions (the plane of the screen), with 3D primitives mapped onto it through transformation matrices.  Through approaches like z-buffering and occlusion culling, games have historically strived to minimize the number of spurious pixels rendered, as normally they do not contribute to the final frame.  And in a perfect world, the pixels rendered would be exactly those that are directly visible from the camera:


Figure 1a: a top-down illustration of various pixel reduction techniques. Top to bottom: no culling, view frustum culling, viewport clipping


Figure 1b: back-face culling, z-buffering


Through the first few years of the new millennium, this approach was sufficient.  Normal and parallax mapping continued to add layers of realism to 3D games, and GPUs provided the ongoing improvements to bandwidth and processing power needed to deliver them.  It wasn’t long, however, until games began using techniques that were incompatible with these optimizations.  Shadow mapping allowed off-screen objects to contribute to on-screen pixels, and environment mapping required a complete spherical representation of the world.  Today, techniques such as screen-space reflection and global illumination are pushing rasterization to its limits, with SSR, for example, being solved with level design tricks, and GI being solved in some cases by processing a full 3D representation of the world using async compute.  In the future, the utilization of full-world 3D data for rendering techniques will only increase.

Figure 2: a top-down view showing how shadow mapping can allow even culled geometry to contribute to on-screen shadows in a scene

Today, we are introducing a feature to DirectX 12 that will bridge the gap between the rasterization techniques employed by games today, and the full 3D effects of tomorrow.  This feature is DirectX Raytracing.  By allowing traversal of a full 3D representation of the game world, DirectX Raytracing allows current rendering techniques such as SSR to naturally and efficiently fill the gaps left by rasterization, and opens the door to an entirely new class of techniques that have never been achieved in a real-time game. Readers unfamiliar with rasterization and raytracing will find more information about the basics of these concepts in the appendix below.


What is DirectX Raytracing?

At the highest level, DirectX Raytracing (DXR) introduces four, new concepts to the DirectX 12 API:

  1. The acceleration structure is an object that represents a full 3D environment in a format optimal for traversal by the GPU.  Represented as a two-level hierarchy, the structure affords both optimized ray traversal by the GPU, as well as efficient modification by the application for dynamic objects.
  2. A new command list method, DispatchRays, which is the starting point for tracing rays into the scene.  This is how the game actually submits DXR workloads to the GPU.
  3. A set of new HLSL shader types including ray-generation, closest-hit, any-hit, and miss shaders.  These specify what the DXR workload actually does computationally.  When DispatchRays is called, the ray-generation shader runs.  Using the new TraceRay intrinsic function in HLSL, the ray generation shader causes rays to be traced into the scene.  Depending on where the ray goes in the scene, one of several hit or miss shaders may be invoked at the point of intersection.  This allows a game to assign each object its own set of shaders and textures, resulting in a unique material.
  4. The raytracing pipeline state, a companion in spirit to today’s Graphics and Compute pipeline state objects, encapsulates the raytracing shaders and other state relevant to raytracing workloads.


You may have noticed that DXR does not introduce a new GPU engine to go alongside DX12’s existing Graphics and Compute engines.  This is intentional – DXR workloads can be run on either of DX12’s existing engines.  The primary reason for this is that, fundamentally, DXR is a compute-like workload. It does not require complex state such as output merger blend modes or input assembler vertex layouts.  A secondary reason, however, is that representing DXR as a compute-like workload is aligned to what we see as the future of graphics, namely that hardware will be increasingly general-purpose, and eventually most fixed-function units will be replaced by HLSL code.  The design of the raytracing pipeline state exemplifies this shift through its name and design in the API. With DX12, the traditional approach would have been to create a new CreateRaytracingPipelineState method.  Instead, we decided to go with a much more generic and flexible CreateStateObject method.  It is designed to be adaptable so that in addition to Raytracing, it can eventually be used to create Graphics and Compute pipeline states, as well as any future pipeline designs.

Anatomy of a DXR Frame

The first step in rendering any content using DXR is to build the acceleration structures, which operate in a two-level hierarchy.  At the bottom level of the structure, the application specifies a set of geometries, essentially vertex and index buffers representing distinct objects in the world.  At the top level of the structure, the application specifies a list of instance descriptions containing references to a particular geometry, and some additional per-instance data such as transformation matrices, that can be updated from frame to frame in ways similar to how games perform dynamic object updates today.  Together, these allow for efficient traversal of multiple complex geometries.

Figure 3: Instances of 2 geometries, each with its own transformation matrix

The second step in using DXR is to create the raytracing pipeline state.  Today, most games batch their draw calls together for efficiency, for example rendering all metallic objects first, and all plastic objects second.  But because it’s impossible to predict exactly what material a particular ray will hit, batching like this isn’t possible with raytracing.  Instead, the raytracing pipeline state allows specification of multiple sets of raytracing shaders and texture resources.  Ultimately, this allows an application to specify, for example, that any ray intersections with object A should use shader P and texture X, while intersections with object B should use shader Q and texture Y.  This allows applications to have ray intersections run the correct shader code with the correct textures for the materials they hit.

The third and final step in using DXR is to call DispatchRays, which invokes the ray generation shader.  Within this shader, the application makes calls to the TraceRay intrinsic, which triggers traversal of the acceleration structure, and eventual execution of the appropriate hit or miss shader.  In addition, TraceRay can also be called from within hit and miss shaders, allowing for ray recursion or “multi-bounce” effects.


Figure 4: an illustration of ray recursion in a scene

Note that because the raytracing pipeline omits many of the fixed-function units of the graphics pipeline such as the input assembler and output merger, it is up to the application to specify how geometry is interpreted.  Shaders are given the minimum set of attributes required to do this, namely the intersection point’s barycentric coordinates within the primitive.  Ultimately, this flexibility is a significant benefit of DXR; the design allows for a huge variety of techniques without the overhead of mandating particular formats or constructs.

PIX for Windows Support Available on Day 1

As new graphics features put an increasing array of options at the disposal of game developers, the need for great tools becomes increasingly important.  The great news is that PIX for Windows will support the DirectX Raytracing API from day 1 of the API’s release.  PIX on Windows supports capturing and analyzing frames built using DXR to help developers understand how DXR interacts with the hardware. Developers can inspect API calls, view pipeline resources that contribute to the raytracing work, see contents of state objects, and visualize acceleration structures. This provides the information developers need to build great experiences using DXR.


What Does This Mean for Games?

DXR will initially be used to supplement current rendering techniques such as screen space reflections, for example, to fill in data from geometry that’s either occluded or off-screen.  This will lead to a material increase in visual quality for these effects in the near future.  Over the next several years, however, we expect an increase in utilization of DXR for techniques that are simply impractical for rasterization, such as true global illumination.  Eventually, raytracing may completely replace rasterization as the standard algorithm for rendering 3D scenes.  That said, until everyone has a light-field display on their desk, rasterization will continue to be an excellent match for the common case of rendering content to a flat grid of square pixels, supplemented by raytracing for true 3D effects.

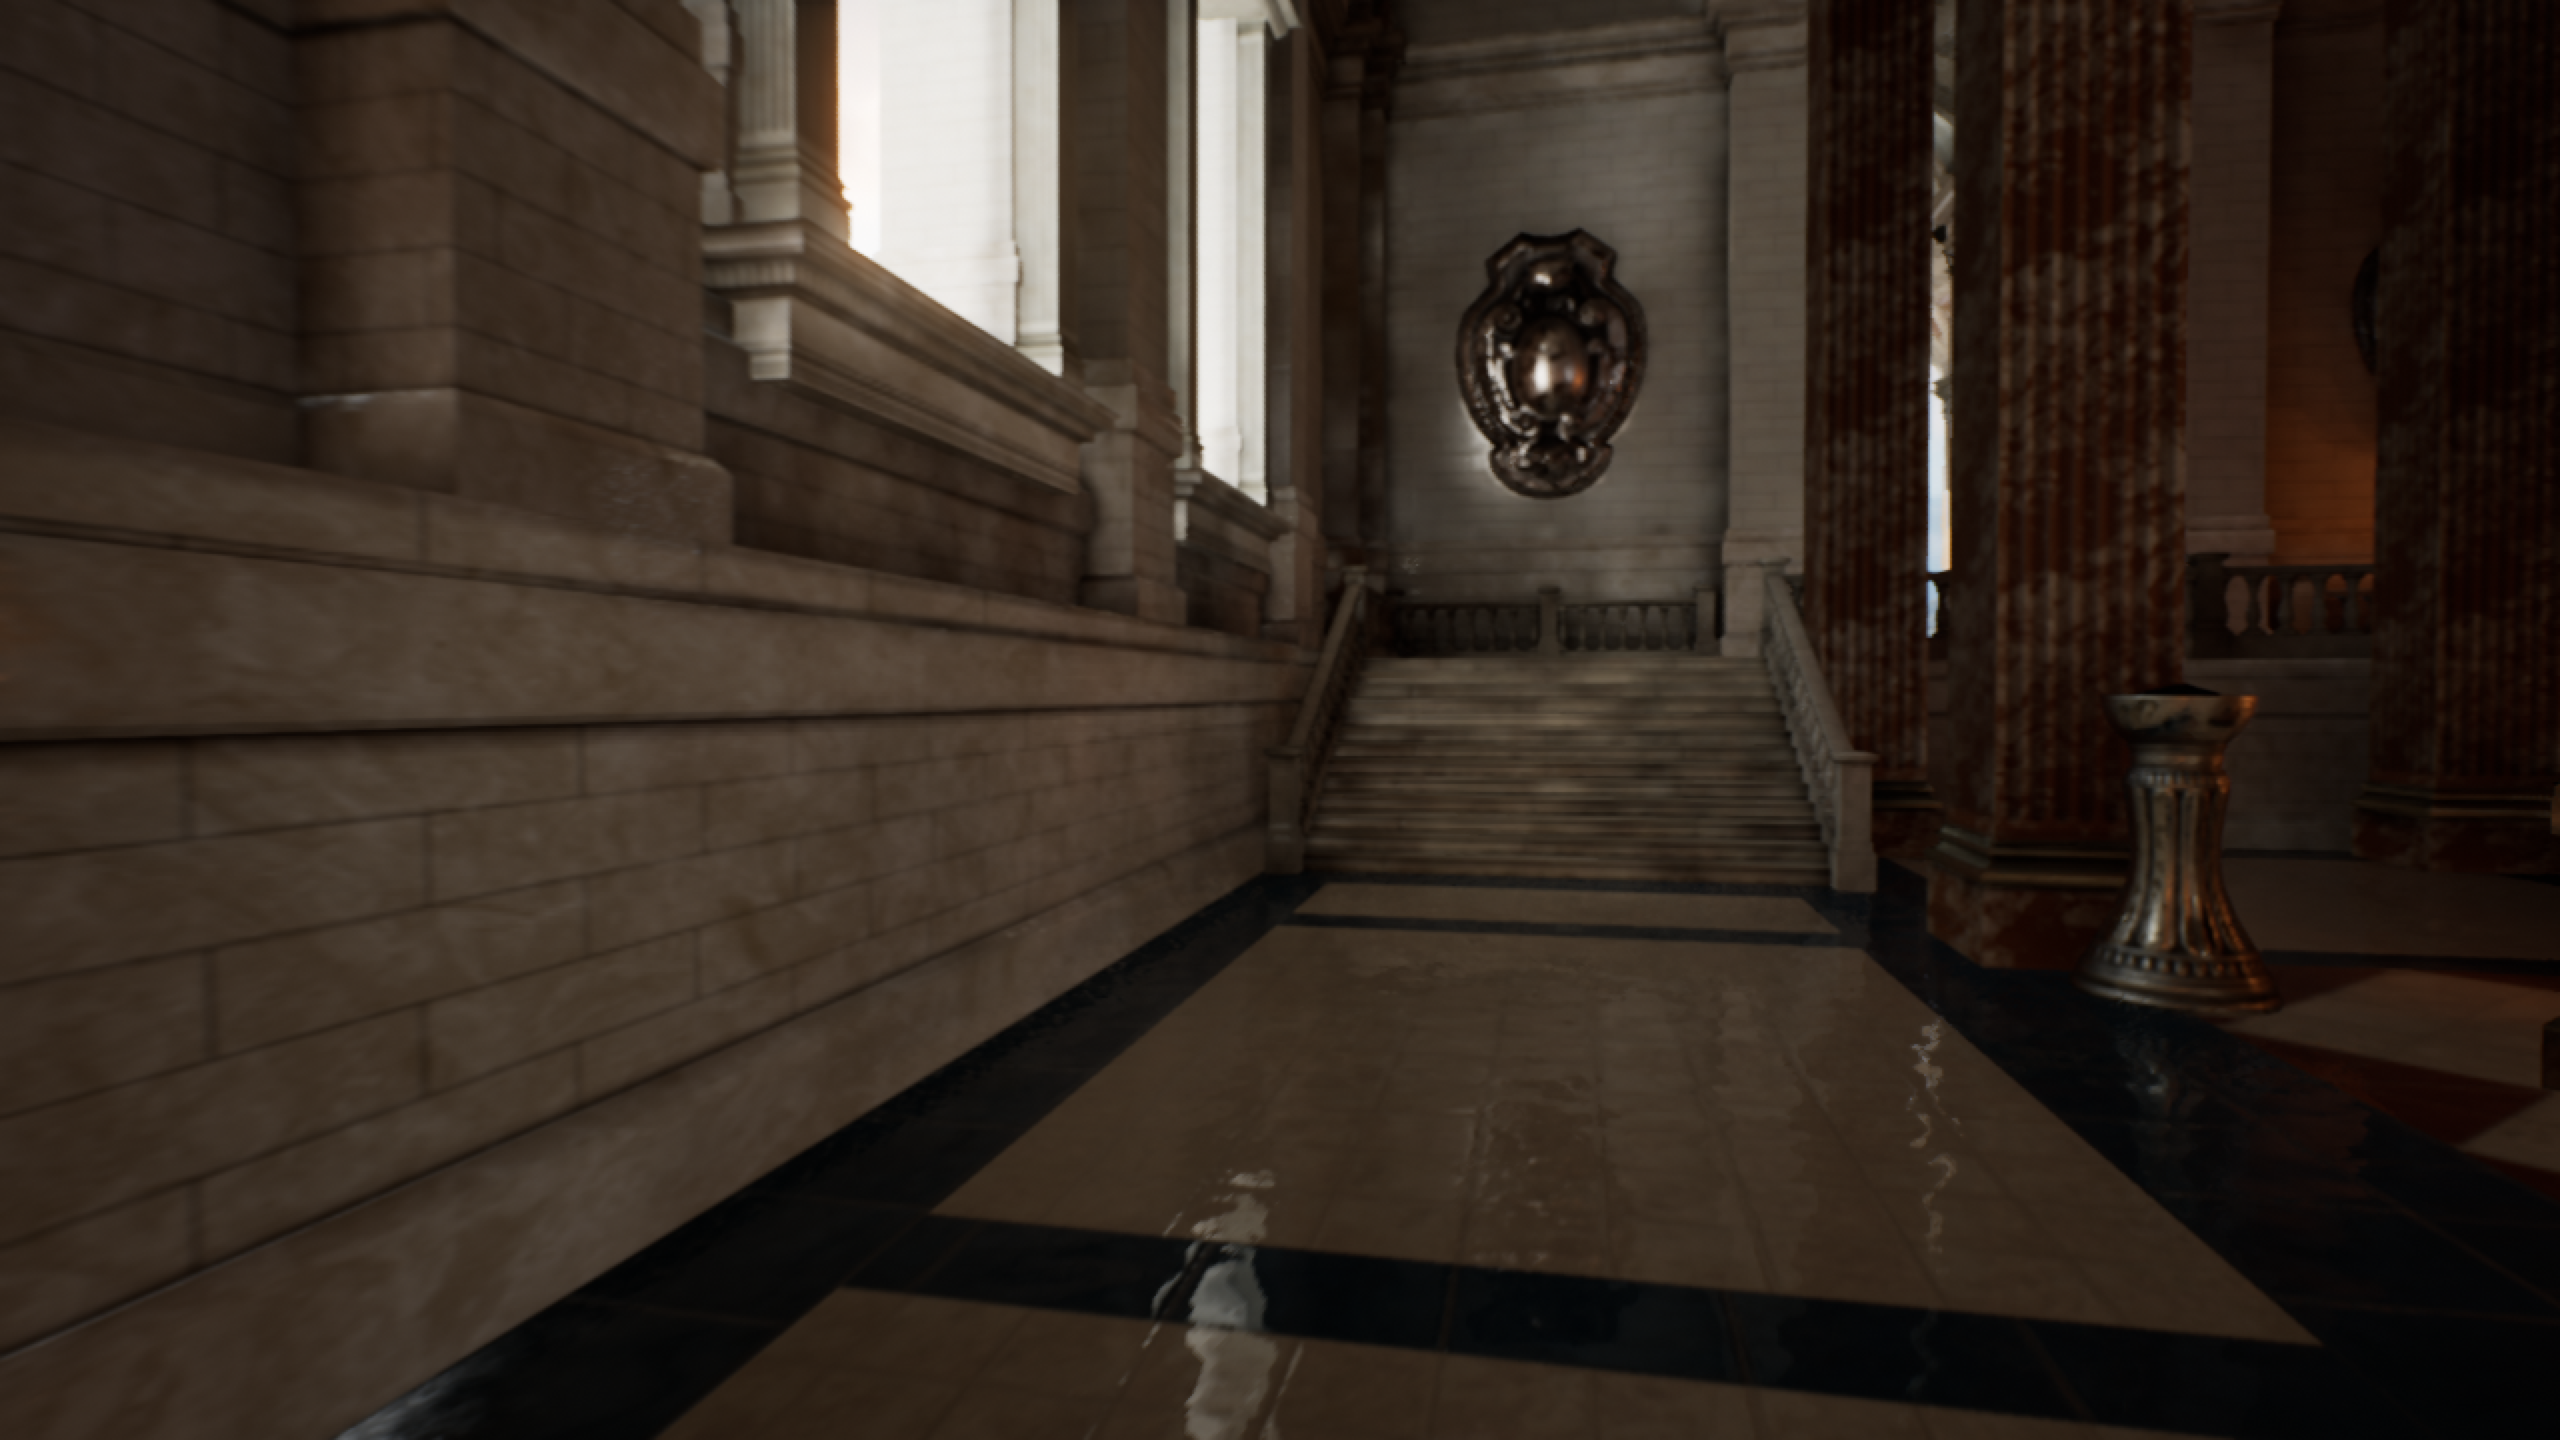
Thanks to our friends at SEED, Electronic Arts, we can show you a glimpse of what future gaming scenes could look like.

Project PICA PICA from SEED, Electronic Arts

And, our friends at EPIC, with collaboration from ILMxLAB and NVIDIA,  have also put together a stunning technology demo with some characters you may recognize.

Of course, what new PC technology would be complete without support from Futuremark benchmark?  Fortunately, Futuremark has us covered with their own incredible visuals.


In addition, while today marks the first public announcement of DirectX Raytracing, we have been working closely with hardware vendors and industry developers for nearly a year to design and tune the API.  In fact, a significant number of studios and engines are already planning to integrate DXR support into their games and engines, including:

Electronic Arts, Frostbite


Electronic Arts,  SEED

Epic Games, Unreal Engine


Futuremark, 3DMark


Unity Technologies, Unity Engine

And more will be coming soon.


What Hardware Will DXR Run On?

Developers can use currently in-market hardware to get started on DirectX Raytracing.  There is also a fallback layer which will allow developers to start experimenting with DirectX Raytracing that does not require any specific hardware support.  For hardware roadmap support for DirectX Raytracing, please contact hardware vendors directly for further details.

Available now for experimentation!

Want to be one of the first to bring real-time raytracing to your game?  Start by attending our Game Developer Conference Session on DirectX Raytracing for all the technical details you need to begin, then download the Experimental DXR SDK and start coding!  Not attending GDC?  No problem!  Click here to see our GDC slides.


Appendix – Primers on rasterization, raytracing and DirectX Raytracing


Intro to Rasterization


Of all the rendering algorithms out there, by far the most widely used is rasterization. Rasterization has been around since the 90s and has since become the dominant rendering technique in video games. This is with good reason: it’s incredibly efficient and can produce high levels of visual realism.


Rasterization is an algorithm that in a sense doesn’t do all its work in 3D. This is because rasterization has a step where 3D objects get projected onto your 2D monitor, before they are colored in. This work can be done efficiently by GPUs because it’s work that can be done in parallel: the work needed to color in one pixel on the 2D screen can be done independently of the work needed to color one the pixel next to it.


There’s a problem with this: in the real world the color of one object will have an impact on the objects around it, because of the complicated interplay of light.  This means that developers must resort to a wide variety of clever techniques to simulate the visual effects that are normally caused by light scattering, reflecting and refracting off objects in the real world. The shadows, reflections and indirect lighting in games are made with these techniques.


Games rendered with rasterization can look and feel incredibly lifelike, because developers have gotten extremely good at making it look as if their worlds have light that acts in convincing way. Having said that, it takes an incredible deal of technical expertise to do this well and there’s also an upper limit to how realistic a rasterized game can get, since information about 3D objects gets lost every time they get projected onto your 2D screen.


Intro to Raytracing


Raytracing calculates the color of pixels by tracing the path of light that would have created it and simulates this ray of light’s interactions with objects in the virtual world. Raytracing therefore calculates what a pixel would look like if a virtual world had real light. The beauty of raytracing is that it preserves the 3D world and visual effects like shadows, reflections and indirect lighting are a natural consequence of the raytracing algorithm, not special effects.


Raytracing can be used to calculate the color of every single pixel on your screen, or it can be used for only some pixels, such as those on reflective surfaces.


How does it work?


A ray gets sent out for each pixel in question. The algorithm works out which object gets hit first by the ray and the exact point at which the ray hits the object. This point is called the first point of intersection and the algorithm does two things here: 1) it estimates the incoming light at the point of intersection and 2) combines this information about the incoming light with information about the object that was hit.


1)      To estimate what the incoming light looked like at the first point of intersection, the algorithm needs to consider where this light was reflected or refracted from.

2)      Specific information about each object is important because objects don’t all have the same properties: they absorb, reflect and refract light in different ways:

-          different ways of absorption are what cause objects to have different colors (for example, a leaf is green because it absorbs all but green light)

-          different rates of reflection are what cause some objects to give off mirror-like reflections and other objects to scatter rays in all directions

-          different rates of refraction are what cause some objects (like water) to distort light more than other objects.

Often to estimate the incoming light at the first point of intersection, the algorithm must trace that light to a second point of intersection (because the light hitting an object might have been reflected off another object), or even further back.


Savvy readers with some programming knowledge might notice some edge cases here.


Sometimes light rays that get sent out never hit anything. Don’t worry, this is an edge case we can cover easily by measuring for how far a ray has travelled so that we can do additional work on rays that have travelled for too far.


The second edge case covers the opposite situation: light might bounce around so much that it’ll slow down the algorithm, or an infinite number of times, causing an infinite loop. The algorithm keeps track of how many times a ray gets traced after every step and gets terminated after a certain number of reflections. We can justify doing this because every object in the real world absorbs some light, even mirrors. This means that a light ray loses energy (becomes fainter) every time it’s reflected, until it becomes too faint to notice. So even if we could, tracing a ray an arbitrary number of times doesn’t make sense.


What is the state of raytracing today?


Raytracing a technique that’s been around for decades. It’s used quite often to do CGI in films and several games already use forms of raytracing. For example, developers might use offline raytracing to do things like pre-calculating the brightness of virtual objects before shipping their games.


No games currently use real-time raytracing, but we think that this will change soon: over the past few years, computer hardware has become more and more flexible: even with the same TFLOPs, a GPU can do more.


How does this fit into DirectX?


We believe that DirectX Raytracing will bring raytracing within reach of real-time use cases, since it comes with dedicated hardware acceleration and can be integrated seamlessly with existing DirectX 12 content.


This means that it’s now possible for developers to build games that use rasterization for some of its rendering and raytracing to be used for the rest. For example, developers can build a game where much of the content is generated with rasterization, but DirectX Raytracing calculates the shadows or reflections, helping out in areas where rasterization is lacking.


This is the power of DirectX Raytracing: it lets developers have their cake and eat it.


Gaming with Windows ML

$
0
0

Neural Networks Will Revolutionize Gaming

Earlier this month, Microsoft announced the availability of Windows Machine Learning. We mentioned the wide-ranging applications of WinML on areas as diverse as security, productivity, and the internet of things. We even showed how WinML can be used to help cameras detect faulty chips during hardware production.

But what does WinML mean for gamers? Gaming has always utilized and pushed adoption of bleeding edge technologies to create more beautiful and magical worlds. With innovations like WinML, which extensively use the GPU, it only makes sense to leverage that technology for gaming. We are ready to use this new technology to empower game developers to use machine learning to build the next generation of games.

Games Reflect Gamers

Every gamer that takes time to play has a different goal – some want to spend time with friends or to be the top competitor, and others are just looking to relax and enjoy a delightful story. Regardless of the reason, machine learning can provide customizability to help gamers have an experience more tailored to their desires than ever before. If a DNN model can be trained on a gamer’s style, it can improve games or the gaming environment by altering everything from difficulty level to avatar appearance to suit personal preferences. DNN models can be trained to adjust difficulty or add custom content can make games more fun as you play along. If your NPC companion is more work than they are worth, DNNs can help solve this issue by making them smarter and more adaptable as they understand your in-game habits in real time. If you’re someone who likes to find treasures in game but don’t care to engage in combat, DNNs could prioritize and amplify those activities while reducing the amount or difficulty of battles. When games can learn and transform along with the players, there is an opportunity to maximize fun and make games better reflect their players.

A great example of this is in EA SEED’s Imitation Learning with Concurrent Actions in 3D Games. Check out their blog and the video below for a deeper dive on how reinforcement and imitation learning models can contribute to gaming experiences.

Better Game Development Processes

There are so many vital components to making a game: art, animation, graphics, storytelling, QA, etc, that can be improved or optimized by the introduction of neural networks. The tools that artists and engineers have at their disposal can make a massive difference to the quality and development cycle of a game and neural networks are improving those tools. Artists should be able to focus on doing their best work: imagine if some of the more arduous parts of terrain design in an open world could be generated by a neural network with the same quality as a person doing it by hand. The artist would then be able to focus on making that world more beautiful and interactive place to play, while in the end generating higher quality and quantity of content for gamers.

A real-world example of a game leveraging neural networks for tooling is Remedy’s Quantum Break. They began the facial animation process by training on a series of audio and facial inputs and developed a model that can move the face based just on new audio input. They reported that this tooling generated facial movement that was 80% of the way done, giving artists time to focus on perfecting the last 20% of facial animation. The time and money that studios could save with more tools like these could get passed down to gamers in the form of earlier release dates, more beautiful games, or more content to play.

Unity has introduced the Unity ML-Agents framework which allows game developers to start experimenting with neural networks in their game right away. By providing an ML-ready game engine, Unity has ensured that developers can start making their games more intelligent with minimal overhead.

Improved Visual Quality

We couldn’t write a graphics blog without calling out how DNNs can help improve the visual quality and performance of games. Take a close look at what happens when NVIDIA uses ML to up-sample this photo of a car by 4x. At first the images will look quite similar, but when you zoom in close, you’ll notice that the car on the right has some jagged edges, or aliasing, and the one using ML on the left is crisper. Models can learn to determine the best color for each pixel to benefit small images that are upscaled, or images that are zoomed in on. You may have had the experience when playing a game where objects look great from afar, but when you move close to a wall or hide behind a crate, things start to look a bit blocky or fuzzy – with ML we may see the end of those types of experiences. If you want to learn more about how up-sampling works, attend NVIDIA’s GDC talk.

ML Super Sampling (left) and bilinear upsampling (right)


What is Microsoft providing to Game Developers? How does it work?

Now that we've established the benefits of neural networks for games, let's talk about what we've developed here at Microsoft to enable games to provide the best experiences with the latest technology.

Quick Recap of WinML

As we disclosed earlier this month, The WinML API allows game developers to take their trained models and perform inference on the wide variety of hardware (CPU, GPU, VPU) found in gaming machines across all vendors. A developer would choose a framework, such as CNTK, Caffe2, or Tensorflow, to build and train a model that does anything from visually improving the game to controlling NPCs. That model would then be converted to the Open Neural Network Exchange (ONNX) format, co-developed between Microsoft, Facebook, and Amazon to ensure neural networks can be used broadly. Once they've done this, they can pipe it up to their game and expect it to run on a gamer's Windows 10 machine with no additional work on the gamer's part. This works, not just for gaming scenarios, but in any situation where you would want to use machine learning on your local machine.


DirectML Technology Overview

We know that performance is a gamer's top priority. So, we built DirectML to provide GPU hardware acceleration for games that use Windows Machine Learning. DirectML was built with the same principles of DirectX technology: speed, standardized access to the latest in hardware features, and most importantly, hassle-free for gamers and game developers – no additional downloads, no compatibility issues - everything just works. To understand why how DirectML fits within our portfolio of graphics technology, it helps to understand what the Machine Learning stack looks like and how it overlaps with graphics.


DirectML is built on top of Direct3D because D3D (and graphics processors) are very good for matrix math, which is used as the basis of all DNN models and evaluations. In the same way that High Level Shader Language (HLSL) is used to execute graphics rendering algorithms, HLSL can also be used to describe parallel algorithms of matrix math that represent the operators used during inference on a DNN. When executed, this HLSL code receives all the benefits of running in parallel on the GPU, making inference run extremely efficiently, just like a graphics application.

In DirectX, games use graphics and compute queues to schedule each frame rendered. Because ML work is considered compute work, it is run on the compute queue alongside all the scheduled game work on the graphics queue. When a model performs inference, the work is done in D3D12 on compute queues. DirectML efficiently records command lists that can be processed asynchronously with your game. Command lists contain machine learning code with instructions to process neurons and are submitted to the GPU through the command queue. This helps to integrate in machine learning workloads with graphics work, which makes bringing ML models to games more efficient and it gives game developers more control over synchronization on the hardware.

Inspired by and Designed for Game Developers

D3D12 Metacommands

As mentioned previously, the principles of DirectX drive us to provide gamers and developers with the fastest technology possible. This means we are not stopping at our HLSL implementation of DirectML neurons – that’s pretty fast but we know that gamers require the utmost in performance. That’s why we’ve been working with graphics hardware vendors to give them the ability to implement even faster versions of those operators directly in the driver for upcoming releases of Windows. We are confident that when vendors implement the operators themselves (vs using our HLSL shaders), they will get better performance for two reasons: their direct knowledge of how their hardware works and their ability to leverage dedicated ML compute cores on their chips. Knowledge of cache sizes and SIMD lanes, plus more control over scheduling are a few examples of the types of advantages vendors have when writing metacommands. Unleashing hardware that is typically not utilized by D3D12 to benefit machine learning helps prove out incredible performance boosts.

Microsoft has partnered with NVIDIA, an industry leader in both graphics and AI in our design and implementation of metacommands. One result of this collaboration is a demo to showcase the power of metacommands. The details of the demo and how we got that performance will be revealed at our GDC talk (see below for details) but for now, here’s a sneak peek of the type of power we can get with metacommands in DirectML. In the preview release of WinML, the data is formatted as floating point 32 (FP32). Some networks do not depend on the level of precision that FP32 offers, so by doing math in FP16, we can process around twice the amount of data in the same amount of time. Since models benefit from this data format, the official release of WinML will support floating point 16 (FP16), which improves performance drastically. We see an 8x speed up using FP16 metacommands in a highly demanding DNN model on the GPU. This model went from static to real-time due to our collaboration with NVIDIA and the power of D3D12 metacommands used in DirectML.

PIX for Windows support available on Day 1

With any new technology, tooling is always vital to success, which is why we’ve ensured that our industry-leading PIX for Windows graphics tool is capable of helping developers with performance profiling models running on the GPU. As you can see below, operators show up where you’d expect them on the compute queue in the PIX timeline. This way, you can see how long each operator takes and where it is scheduled. In addition, you can add up all the GPU time in the roll up window in order to understand how long the network is taking overall.


Support for Windows Machine Learning in Unity ML-Agents

Microsoft and Unity share a goal of democratizing AI for gaming and game development. To advance that goal, we’d like to announce that we will be working together to provide support for Windows Machine Learning in Unity’s ML-Agents framework. Once this ships, Unity games running on Windows 10 platforms will have access to inference across all hardware and the hardware acceleration that comes with DirectML. This, combined with the convenience of using an ML-ready engine, will make getting started with Machine Learning in gaming easier than ever before.


Getting Started with Windows Machine Learning

Game developers can start testing out WinML and DirectML with their models today. They will get all the benefit of hardware breadth and hardware acceleration with HLSL implementations of operators. The benefits of metacommands will be coming soon as we release more features of DirectML. If you're attending GDC, check out the talks we are giving below. If not, stay tuned to the DirectX blog for more updates and resources on how to get started after our sessions. Gamers can simply keep up to date with the latest version of Windows and they will start to see new features in games and applications on Windows as they are released.

UPDATE: For more instructions on how to get started, please check out the forums on DirectXTech.com. Here, you can read about how to get started with WinML, stay tuned in to updates when they happen, and post your questions/issues so we can help resolve them for you quickly.

GDC talks

If you're a game developer and attending GDC on Thursday, March 22nd, please attend our talks to get a practical technical deep dive of what we're offering to developers. We will be co-presenting with NV on our work to bring Machine Learning to games.

Using Artificial Intelligence to Enhance your Game (1 of 2)
This talk will be focused on how we address how to get started with WinML and the breadth of hardware it covers.

UPDATE: Click here for the slides from this talk.

Using Artificial Intelligence to Enhance Your Game, Part 2 (Presented by NVIDIA)
After a short recap of the first talk, we'll dive into how we're helping to provide developers the performance necessary to use ML in their games.

UPDATE: Click here for the slides from this talk.

Recommended Resources:

NVIDIA's AI Podcast is a great way to learn more about the applications of AI - no tech background needed.
• If you want to get coding fast with CNTK, check out this EdX class - great for a developer who wants a hands-on approach.
• To get a deep understanding of the math and theory behind deep learning, check out Andrew Ng's Coursera Course


Appendix: Brief introduction to Machine Learning

"Shall we play a game?" - Joshua, War Games

The concept of Artificial Intelligence in gaming is nothing new to the tech saavy gamer or sci-fi film fan, but the Microsoft Machine Learning team is working to enable game developers to take advantage of the latest advances in Machine Learning and start developing Deep Neural Networks for their games. We recently announced our AI platform for Windows AI developers and showed some examples of how Windows Machine Learning is changing way we do business, but we also care about changing the way that we develop and play games. AI, ML, DNN - are these all buzzwords that mean the same thing? Not exactly; we'll dive in to what Neural Networks are, how they can make games better, and how Microsoft is enabling game developers to bring that technology to wherever you game best.


Neural networks are a subset of ML which is a subset of AI.


What are Neural Networks and where did they come from?

People have been speculating on how to make computers think more like humans for a long time and emulating the brain seems like an obvious first step. The behind research Neural Networks (NNs) started in the early 1940s and fizzled out in the late '60s, due to the limitations in computational power. In the last decade, Graphics Processing Units (GPUs) have exponentially increased the amount of math that can be performed in a short amount of time (thanks to demand from the gaming industry). The ability to quickly do a massive amount of matrix math revitalized interest in neural networks - created by processing large amounts of data through layers of nodes (neurons) that can learn about properties of that data and those layers of nodes make up a model. That learning process is called training. If the model is correctly trained, when it is fed a new piece of data, it performs inference on that data and should correctly be able to predict the properties of data it has never seen before. That network becomes a deep neural network (DNN) if it has two or more hidden layers of neurons.

There are many types of Neural Networks and they all have different properties and uses. An example is a Convolutional Neural Network (CNN) that uses a matrix filtering system that identifies and breaks images down into their most basic characteristics, called features, and then uses that break down in the model to determine if new images share those characteristics. What makes a cat different from a dog? Humans know the difference just by looking, but how could a computer when they share a lot of characteristics - 4 legs, tails, whiskers, and fur. With CNNs, the model will learn the subtle differences in the shape of a cat's nose versus a dog's snout and use that knowledge to correctly classify images.

Here’s an example of what a convolution layer looks like in a CNN (Squeezenet visualized with Netron).


For best performance, use DXGI flip model

$
0
0

This document picks up where the MSDN “DXGI flip model” article and YouTube DirectX 12: Presentation Modes In Windows 10 and Presentation Enhancements in Windows 10: An Early Look videos left off.  It provides developer guidance on how to maximize performance and efficiency in the presentation stack on modern versions of Windows.


Call to action

If you are still using DXGI_SWAP_EFFECT_DISCARD or DXGI_SWAP_EFFECT_SEQUENTIAL (aka "blt" present model), it's time to stop!

Switching to DXGI_SWAP_EFFECT_FLIP_SEQUENTIAL or DXGI_SWAP_EFFECT_FLIP_DISCARD (aka flip model) will give better performance, lower power usage, and provide a richer set of features.

Flip model presents go as far as making windowed mode effectively equivalent or better when compared to the classic "fullscreen exclusive" mode. In fact, we think it’s high time to reconsider whether your app actually needs a fullscreen exclusive mode, since the benefits of a flip model borderless window include faster Alt-Tab switching and better integration with modern display features.

Why now? Prior to the upcoming Spring Creators Update, blt model presents could result in visible tearing when used on hybrid GPU configurations, often found in high end laptops (see KB 3158621). In the Spring Creators Update, this tearing has been fixed, at the cost of some additional work. If you are doing blt presents at high framerates across hybrid GPUs, especially at high resolutions such as 4k, this additional work may affect overall performance.  To maintain best performance on these systems, switch from blt to flip present model. Additionally, consider reducing the resolution of your swapchain, especially if it isn’t the primary point of user interaction (as is often the case with VR preview windows).


A brief history

What is flip model? What is the alternative?

Prior to Windows 7, the only way to present contents from D3D was to "blt" or copy it into a surface which was owned by the window or screen. Beginning with D3D9’s FLIPEX swapeffect, and coming to DXGI through the FLIP_SEQUENTIAL swap effect in Windows 8, we’ve developed a more efficient way to put contents on screen, by sharing it directly with the desktop compositor, with minimal copies. See the original MSDN article for a high level overview of the technology.

This optimization is possible thanks to the DWM: the Desktop Window Manager, which is the compositor that drives the Windows desktop.


When should I use blt model?

There is one piece of functionality that flip model does not provide: the ability to have multiple different APIs producing contents, which all layer together into the same HWND, on a present-by-present basis. An example of this would be using D3D to draw a window background, and then GDI to draw something on top, or using two different graphics APIs, or two swapchains from the same API, to produce alternating frames. If you don’t require HWND-level interop between graphics components, then you don’t need blt model.

There is a second piece of functionality that was not provided in the original flip model design, but is available now, which is the ability to present at an unthrottled framerate. For an application which desires using sync interval 0, we do not recommend switching to flip model unless the IDXGIFactory5::CheckFeatureSupport API is available, and reports support for DXGI_FEATURE_PRESENT_ALLOW_TEARING.  This feature is nearly ubiquitous on recent versions of Windows 10 and on modern hardware.


What’s new in flip model?

If you’ve watched the YouTube video linked above, you’ll see talk about "Direct Flip" and "Independent Flip". These are optimizations that are enabled for applications using flip model swapchains. Depending on window and buffer configuration, it is possible to bypass desktop composition entirely, and directly send application frames to the screen, in the same way that exclusive fullscreen does.

These days, these optimizations can engage in one of 3 scenarios, with increasing functionality:

  1. DirectFlip: Your swapchain buffers match the screen dimensions, and your window client region covers the screen. Instead of using the DWM swapchain to display on the screen, the application swapchain is used instead.
  2. DirectFlip with panel fitters: Your window client region covers the screen, and your swapchain buffers are within some hardware-dependent scaling factor (e.g. 0.25x to 4x) of the screen. The GPU scanout hardware is used to scale your buffer while sending it to the display.
  3. DirectFlip with multi-plane overlay (MPO): Your swapchain buffers are within some hardware-dependent scaling factor of your window dimensions. The DWM is able to reserve a dedicated hardware scanout plane for your application, which is then scanned out and potentially stretched, to an alpha-blended sub-region of the screen.

With windowed flip model, the application can query hardware support for different DirectFlip scenarios and implement different types of dynamic scaling via use of IDXGIOutput6:: CheckHardwareCompositionSupport. One caveat to keep in mind is that if panel fitters are utilized, it’s possible for the cursor to suffer stretching side effects, which is indicated via DXGI_HARDWARE_COMPOSITION_SUPPORT_FLAG_CURSOR_STRETCHED.

Once your swapchain has been "DirectFlipped", then the DWM can go to sleep, and only wake up when something changes outside of your application. Your app frames are sent directly to screen, independently, with the same efficiency as fullscreen exclusive. This is "Independent Flip", and can engage in all of the above scenarios.  If other desktop contents come on top, the DWM can either seamlessly transition back to composed mode, efficiently "reverse compose" the contents on top of the application before flipping it, or leverage MPO to maintain the independent flip mode.

Check out the PresentMon tool to get insight into which of the above was used.


What else is new in flip model?

In addition to the above improvements, which apply to standard swapchains without anything special, there are several features available for flip model applications to use:

  • Decreasing latency using DXGI_SWAP_CHAIN_FLAG_FRAME_LATENCY_WAITABLE_OBJECT. When in Independent Flip mode, you can get down to 1 frame of latency on recent versions of Windows, with graceful fallback to the minimum possible when composed.
  • DXGI_SWAP_EFFECT_FLIP_DISCARD enables a "reverse composition" mode of direct flip, which results in less overall work to display the desktop. The DWM can scribble on the app buffers and send those to screen, instead of performing a full copy into their own swapchain.
  • DXGI_SWAP_CHAIN_FLAG_ALLOW_TEARING can enable even lower latency than the waitable object, even in a window on systems with multi-plane overlay support.
  • Control over content scaling that happens during window resize, using the DXGI_SCALING property set during swapchain creation.
  • Content in HDR formats (R10G10B10A2_UNORM or R16G16B16A16_FLOAT) isn’t clamped unless it’s composed to a SDR desktop.
  • Present statistics are available in windowed mode.
  • Greater compatibility with UWP app-model and DX12 since these are only compatible with flip-model.


What do I have to do to use flip model?

Flip model swapchains have a few additional requirements on top of blt swapchains:

  1. The buffer count must be at least 2.
  2. After Present calls, the back buffer needs to explicitly be re-bound to the D3D11 immediate context before it can be used again.
  3. After calling SetFullscreenState, the app must call ResizeBuffers before Present.
  4. MSAA swapchains are not directly supported in flip model, so the app will need to do an MSAA resolve before issuing the Present.


How to choose the right rendering and presentation resolutions

The traditional pattern for apps in the past has been to provide the user with a list of resolutions to choose from when the user selects exclusive fullscreen mode. With the ability of modern displays to seamlessly begin scaling content, consider providing users with the ability to choose a rendering resolution for performance scaling, independent from an output resolution, and even in windowed mode. Furthermore, applications should leverage IDXGIOutput6:: CheckHardwareCompositionSupport to determine if they need to scale the content before presenting it, or if they should let the hardware do the scaling for them.

Your content may need to be migrated from one GPU to another as part of the present or composition operation. This is often true on multi-GPU laptops, or systems with external GPUs plugged in. As these configurations get more common, and as high-resolution displays become more common, the cost of presenting a full resolution swapchain increases.  If the target of your swapchain isn’t the primary point of user interaction, as is often the case with VR titles that present a 2D preview of the VR scene into a secondary window, consider using a lower resolution swapchain to minimize the amount of bandwidth that needs to be transferred across different GPUs.


Other considerations

The first time you ask the GPU to write to the swapchain back buffer is the time that the GPU will stall waiting for the buffer to become available. When possible, delay this point as far into the frame as possible.

DirectX Raytracing and the Windows 10 October 2018 Update

$
0
0

DirectX Raytracing and the Windows 10 October 2018 Update

The wait is finally over: we’re taking DirectX Raytracing (DXR) out of experimental mode!

Today, once you update to the next release of Windows 10, DirectX Raytracing will work out-of-box on supported hardware. And speaking of hardware, the first generation of graphics cards with native raytracing support is already available and works with the October 2018 Windows Update.

The first wave of DirectX Raytracing in games is coming soon, with the first three titles that support our API: Battlefield V, Metro Exodus and Shadow of the Tomb Raider. Gamers will be able to have raytracing on their machines in the near future!

Raytracing and Windows

We’ve worked for many years to make Windows the best platform for PC Gaming and believe that DirectX Raytracing is a major leap forward for gamers on our platform. We built DirectX Raytracing with ubiquity in mind: it’s an API that was built to work across hardware from all vendors.

Real-time raytracing is often quoted as being the holy grail of graphics and it’s a key part of a decades-long dream to achieve realism in games. Today marks a key milestone in making this dream a reality: gamers now have access to both the OS and hardware to support real-time raytracing in games. With the first few titles powered by DirectX Raytracing just around the corner, we’re about to take the first step into a raytraced future.

This was made possible with hard work here at Microsoft and the great partnerships that we have with the industry. Without the solid collaboration from our partners, today’s announcement would not have been possible.

What does this mean for gaming?

DirectX Raytracing allows games to achieve a level of realism unachievable by traditional rasterization. This is because raytracing excels in areas where traditional rasterization is lacking, such as reflections, shadows and ambient occlusion. We specifically designed our raytracing API to be used alongside rasterization-based game pipelines and for developers to be able to integrate DirectX Raytracing support into their existing engines, without the need to rebuild their game engines from the ground up.

The difference that raytracing makes to a game is immediately apparent and this is something that the industry recognizes: DXR is one of the fastest adopted features that we’ve released in recent years.

Several studios have partnered with our friends at NVIDIA, who created RTX technology to make DirectX Raytracing run as efficiently as possible on their hardware:

EA’s Battlefield V will have support for raytraced reflections.

These reflections are impossible in real-time games that use rasterization only: raytraced reflections include assets that are off-screen, adding a whole new level of immersion as seen in the image above.

Shadow of the Tomb Raider will have DirectX Raytracing-powered shadows.

The shadows in Shadow of the Tomb Raider showcase DirectX Raytracing's ability to render lifelike shadows and shadow interactions that more realistic than what’s ever been showcased in a game.

Metro Exodus will use DirectX Raytracing for global illumination and ambient occlusion

Metro Exodus will have high-fidelity natural lighting and contact shadows, resulting in an environment where light behaves just as it does in real life.

These games will be followed by the next wave of titles that make use of raytracing.

We’re still in the early days of DirectX Raytracing and are excited not just about the specific effects that have already been implemented using our API, but also about the road ahead.

DirectX Raytracing is well-suited to take advantage of today’s trends: we expect DXR to open an entirely new class of techniques and revolutionize the graphics industry.

DirectX Raytracing and hardware trends

Hardware has become increasingly flexible and general-purpose over the past decade: with the same TFLOPs today’s GPU can do more and we only expect this trend to continue.

We designed DirectX Raytracing with this in mind: by representing DXR as a compute-like workload, without complex state, we believe that the API is future-proof and well-aligned with the future evolution of GPUs: DXR workloads will fit naturally into the GPU pipelines of tomorrow.

DirectML

DirectX Raytracing benefits not only from advances in hardware becoming more general-purpose, but also from advances in software.

In addition to the progress we’ve made with DirectX Raytracing, we recently announced a new public API, DirectML, which will allow game developers to integrate inferencing into their games with a low-level API. To hear more about this technology, releasing in Spring 2019, check out our SIGGRAPH talk.

ML techniques such as denoising and super-resolution will allow hardware to achieve impressive raytraced effects with fewer rays per pixel. We expect DirectML to play a large role in making raytracing more mainstream.

DirectX Raytracing and Game Development

Developers in the future will be able to spend less time with expensive pre-computations generating custom lightmaps, shadow maps and ambient occlusion maps for each asset.

Realism will be easier to achieve for game engines: accurate shadows, lighting, reflections and ambient occlusion are a natural consequence of raytracing and don’t require extensive work refining and iterating on complicated scene-specific shaders.

EA’s SEED division, the folks who made the PICA PICA demo, offer a glimpse of what this might look like: they were able to achieve an extraordinarily high level of visual quality with only three artists on their team!

Crossing the Uncanny Valley

We expect the impact of widespread DirectX Raytracing in games to be beyond achieving specific effects and helping developers make their games faster.

The human brain is hardwired to detect realism and is especially sensitive to realism when looking at representations of people: we can intuitively feel when a character in a game looks and feels “right”, and much of this depends on accurate lighting. When a character gets really close to looking as a real human should, but slightly misses the mark, it becomes unnerving to look at. This effect is known as the uncanny valley.

Because true-to-life lighting is a natural consequence of raytracing, DirectX Raytracing will allow games to get much closer to crossing the uncanny valley, allowing developers to blur the line between the real and the fake. Games that fully cross the uncanny valley will gave gamers total immersion in their virtual environments and interactions with in-game characters. Simply put, DXR will make games much more believable.

How do I get the October 2018 Update?

As of 2pm PST today, this update is now available to the public. As with all our updates, rolling out the October 2018 Update will be a gradual process, meaning that not everyone will get it automatically on day one.

It’s easy to install this update manually: you’ll be able to update your machine using this link soon after 2pm PST on October 2nd.

Developers eager to start exploring the world of real-time raytracing should go to the directxtech forum’s raytracing board for the latest DirectX Raytracing spec, developer samples and our getting started guide.

World of Warcraft uses DirectX 12 running on Windows 7

$
0
0

Blizzard added DirectX 12 support for their award-winning World of Warcraft game on Windows 10 in late 2018. This release received a warm welcome from gamers: thanks to DirectX 12 features such as multi-threading, WoW gamers experienced substantial framerate improvement. After seeing such performance wins for their gamers running DirectX 12 on Windows 10, Blizzard wanted to bring wins to their gamers who remain on Windows 7, where DirectX 12 was not available.

At Microsoft, we make every effort to respond to customer feedback, so when we received this feedback from Blizzard and other developers, we decided to act on it. Microsoft is pleased to announce that we have ported the user mode D3D12 runtime to Windows 7. This unblocks developers who want to take full advantage of the latest improvements in D3D12 while still supporting customers on older operating systems.

Today, with game patch 8.1.5 for World of Warcraft: Battle for Azeroth, Blizzard becomes the first game developer to use DirectX 12 for Windows 7! Now, Windows 7 WoW gamers can run the game using DirectX 12 and enjoy a framerate boost, though the best DirectX 12 performance will always be on Windows 10, since Windows 10 contains a number of OS optimizations designed to make DirectX 12 run even faster.

We’d like to thank the development community for their feedback. We’re so excited that we have been able to partner with our friends in the game development community to bring the benefits of DirectX 12 to all their customers. Please keep the feedback coming!


FAQ
Any other DirectX 12 game coming to Windows 7?
We are currently working with a few other game developers to port their D3D12 games to Windows 7. Please watch out for further announcement.

How are DirectX 12 games different between Windows 10 and Windows 7?
Windows 10 has critical OS improvements which make modern low-level graphics APIs (including DirectX 12) run more efficiently. If you enjoy your favorite games running with DirectX 12 on Windows 7, you should check how those games run even better on Windows 10!

World of Warcraft uses DirectX 12 running on Windows 7

$
0
0

Blizzard added DirectX 12 support for their award-winning World of Warcraft game on Windows 10 in late 2018. This release received a warm welcome from gamers: thanks to DirectX 12 features such as multi-threading, WoW gamers experienced substantial framerate improvement. After seeing such performance wins for their gamers running DirectX 12 on Windows 10, Blizzard wanted to bring wins to their gamers who remain on Windows 7, where DirectX 12 was not available.

At Microsoft, we make every effort to respond to customer feedback, so when we received this feedback from Blizzard and other developers, we decided to act on it. Microsoft is pleased to announce that we have ported the user mode D3D12 runtime to Windows 7. This unblocks developers who want to take full advantage of the latest improvements in D3D12 while still supporting customers on older operating systems.

Today, with game patch 8.1.5 for World of Warcraft: Battle for Azeroth, Blizzard becomes the first game developer to use DirectX 12 for Windows 7! Now, Windows 7 WoW gamers can run the game using DirectX 12 and enjoy a framerate boost, though the best DirectX 12 performance will always be on Windows 10, since Windows 10 contains a number of OS optimizations designed to make DirectX 12 run even faster.

We’d like to thank the development community for their feedback. We’re so excited that we have been able to partner with our friends in the game development community to bring the benefits of DirectX 12 to all their customers. Please keep the feedback coming!

FAQ
Any other DirectX 12 game coming to Windows 7?
We are currently working with a few other game developers to port their D3D12 games to Windows 7. Please watch out for further announcement.

How are DirectX 12 games different between Windows 10 and Windows 7?
Windows 10 has critical OS improvements which make modern low-level graphics APIs (including DirectX 12) run more efficiently. If you enjoy your favorite games running with DirectX 12 on Windows 7, you should check how those games run even better on Windows 10!

The post World of Warcraft uses DirectX 12 running on Windows 7 appeared first on DirectX Developer Blog.

Variable Rate Shading: a scalpel in a world of sledgehammers

$
0
0

One of the sides in the picture below is 14% faster when rendered on the same hardware, thanks to a new graphics feature available only on DirectX 12. Can you spot a difference in rendering quality?

Neither can we.  Which is why we’re very excited to announce that DirectX 12 is the first graphics API to offer broad hardware support for Variable Rate Shading.

What is Variable Rate Shading?

In a nutshell, it’s a powerful new API that gives the developers the ability to use GPUs more intelligently.

Let’s explain.

For each pixel in a screen, shaders are called to calculate the color this pixel should be. Shading rate refers to the resolution at which these shaders are called (which is different from the overall screen resolution). A higher shading rate means more visual fidelity, but more GPU cost; a lower shading rate means the opposite: lower visual fidelity that comes at a lower GPU cost.

Traditionally, when developers set a game’s shading rate, this shading rate is applied to all pixels in a frame.

There’s a problem with this: not all pixels are created equal.

VRS allows developers to selectively reduce the shading rate in areas of the frame where it won’t affect visual quality, letting them gain extra performance in their games. This is really exciting, because extra perf means increased framerates and lower-spec’d hardware being able to run better games than ever before.

VRS also lets developers do the opposite: using an increased shading rate only in areas where it matters most, meaning even better visual quality in games.

On top of that, we designed VRS to be extremely straightforward for developers to integrate into their engines. Only a few days of dev work integrating VRS support can result in large increases in performance.

Our VRS API lets developers set the shading rate in 3 different ways:

  • Per draw
  • Within a draw by using a screenspace image
  • Or within a draw, per primitive

There are two flavors, or tiers, of hardware with VRS support. The hardware that can support per-draw VRS hardware are Tier 1. There’s also a Tier 2, the hardware that can support both per-draw and within-draw variable rate shading.

Tier 1

By allowing developers to specify the per-draw shading rate, different draw calls can have different shading rates.

For example, a developer could draw a game’s large environment assets, assets in a faraway plane, or assets obscured behind semitransparency at a lower shading rate, while keeping a high shading rate for more detailed assets in a scene.

Tier 2

As mentioned above, Tier 2 hardware offer the same functionality and more, by also allowing developers to specify the shading rate within a draw, with a screenspace image or per-primitive. Let’s explain:

Screenspace image

Think of a screenspace image as reference image for what shading rate is used for what portion of the screen.

By allowing developers to specify the shading rate using a screenspace image, we open up the ability for a variety of techniques.

For example, foveated rendering, rendering the most detail in the area where the user is paying attention, and gradually decreasing the shading rate outside this area to save on performance. In a first-person shooter, the user is likely paying most attention to their crosshairs, and not much attention to the far edges of the screen, making FPS games an ideal candidate for this technique.

Another use case for a screenspace image is using an edge detection filter to determine the areas that need a higher shading rate, since edges are where aliasing happens. Once the locations of the edges are known, a developer can set the screenspace image based on that, shading the areas where the edges are with high detail, and reducing the shading rate in other areas of the screen. See below for more on this technique…

Per-primitive

Specifying the per-primitive shading rate means that developers can within a draw, specify the shading rate per triangle.

One use case for this would be for developers who know they are applying a depth-of-field blur in their game to render all triangles beyond some distance at a lower shading rate. This won’t lead to a degradation in visual quality, but will lead to an increase in performance, since these faraway triangles are going to be blurry anyway.

Developers won’t have to choose between techniques

We’re also introducing combiners, which allow developers to combine per-draw, screenspace image and per-primitive VRS at the same time. For example, a developer who’s using a screenspace image for foveated rendering can, using the VRS combiners, also apply per-primitive VRS to render faraway objects at lower shading rate.

What does this actually look like in practice?

We partnered with Firaxis games to see what VRS can do for a game on NVIDIA hardware that exists today.

They experimented with both adding both per-draw and per-screenspace image support to their game. These experiments were done using an GeForce RTX 2060 to draw at 4K resolution. Before adding VRS support, the scene they looked at would run at around 53 FPS.

Tier 1 support

Firaxis’s first experiment was to add Tier 1 support to their game: drawing terrain and water at a lower shading rate (2×2), and drawing smaller assets (vehicles, buildings and UI drawn) at a higher shading rate (1×1).

See if you can tell which one of these images is the game with Tier 1 VRS enabled and which one is the game without.

With this initial Tier 1 implementation they were able to see ~20% increase in FPS for this game map at this zoom

Tier 2 support

But is there a way to get even better quality, while still getting a significant performance improvement?

In the figure above, righthand image is the one with VRS ON – observant users might notice some slight visual degradations.

For this game, isolating the visual degradations on the righthand image and fixing them is not as simple as pointing to individual draw calls and adjusting their shading rates.

Parts of assets in the same draw require different shading rates to get optimal GPU performance without sacrificing visual quality, but luckily Tier 2’s screenspace image is here to help.

Using an edge detection filter to work out where high detail is required and then setting a screenspace image, Firaxis was still able to gain a performance win, while preserving lots of detail.

Now it’s almost impossible to tell which image has VRS ON and which one has VRS OFF:

This is the same image we started this article with. It’s the lefthand image that has VRS ON

For the same scene, Firaxis saw a 14% increase in FPS with their screenspace image implementation.

Firaxis also implemented a nifty screenspace image visualizer, for us graphics folks to see this in action:

Red indicates the areas where the shading rate is set to 1×1, and blue indicates where it’s at 2×2

Broad hardware support

In the DirectX team, we want to make sure that our features work on as much of our partners’ hardware as possible.

VRS support exists today on in-market NVIDIA hardware and on upcoming Intel hardware.

Intel’s already started doing experiments with variable rate shading on prototype Gen11 hardware, scheduled to come out this year.

With their initial proof-of-concept usage of VRS in UE4’s Sun Temple, they were able to show a significant performance win.

Above is a screenshot of this work, running on prototype Gen11 hardware.

To see their prototype hardware in action and for more info, come to Microsoft’s VRS announcement session and check out Intel’s booth at GDC.

PIX for Windows Support Available on Day 1

As we add more options to DX12 for our developers, we also make sure that they have the best tooling possible. PIX for Windows will support the VRS API from day 1 of the API’s release. PIX on Windows supports capturing and replaying VRS API calls, allowing developers to inspect the shading rate and its impact on their rendering work. The PIX download portal’s latest version of PIX has all these features.

All of this means that developers who want to integrate VRS support into their engines have tooling on day 1.

What Does This Mean for Games?

Developers now have an incredibly flexible tool in their toolbelt, allowing them to increase performance and quality without any invasive code changes.

In the future, once VRS hardware becomes more widespread, we expect an even wider range of hardware to be able to run graphically intensive games. Games taking full advantage of VRS will be able to use the extra performance to run at increased framerates, higher resolutions and with less aliasing.

Several studio and engine developers intend to add VRS support to their engines/games, including:


Available today!

Want to be one of the first to get VRS in your game?

Start by attending our Game Developer Conference sponsored sessions on Variable Rate Shading for all the technical details you need to start coding. Our first session will be an introduction to the feature. Come to our second session for deep dive into how implement VRS into your title.

Not attending GDC?  No problem!

We’ve updated the directxtech forums with a getting started guide, a link to the VRS spec and a link to a sample for developers to get started. We’ll also upload our slides after our GDC talks.


The post Variable Rate Shading: a scalpel in a world of sledgehammers appeared first on DirectX Developer Blog.

DirectML at GDC 2019

$
0
0
Introduction

Last year at GDC, we shared our excitement about the many possibilities for using machine learning in game development. If you’re unfamiliar with machine learning or neural networks, I strongly encourage you to check out our blog post from last year, which is a primer for many of the topics discussed in this post.

This year, we’re furthering our commitment to enable ML in games by making DirectML publicly available for the first time. We continuously engage with our customers and heard the need for a GPU-inferencing API that gives developers more control over their workloads to make integration with rendering engines easier. With DirectML, game developers write code once and their ML scenario works on all DX12-capable GPUs – a hardware agnostic solution at the operator level. We provide the consistency and performance required to integrate innovations in ML into rendering engines.

Additionally, Unity announced plans to support DirectML in their Unity Inference Engine that powers Unity ML Agents. Their decision to adopt DirectML was driven by the available hardware acceleration on Windows platforms while maintaining control of the data locality and the execution flow. By utilizing the regular graphics pipeline, they are saving on GPU stalls and have full integration with the rendering engine. Unity is in the process of integrating DirectML into their inference engine to allow developers to take advantage of metacommands and other optimizations available with DirectML.

A corgi holding a stick in Unity's ML Agents

We are very excited about our collaboration with Unity and the promise this brings to the industry. Providing developers fast inferencing across a broad set of platforms democratizes machine learning in games and improves the industry by proving out that ML can be integrated well with rendering work to enable novel experiences for gamers. With DirectML, we want to ensure that applications run well across all Windows hardware and empower developers to confidently ship machine learning models on lightweight laptops and hardcore gaming rigs alike. From a single model to a custom inference engine, DirectML will give you the most out of your hardware.


Why DirectML

Many new real-time inferencing scenarios have been introduced to the developer community over the last few years through cutting edge machine learning research. Some examples of these are super resolution, denoising, style transfer, game testing, and tools for animation and art. These models are computationally expensive but in many cases are required to run in real-time. DirectML enables these to run with high-performance by providing a wide set of optimized operators without the overhead of traditional inferencing engines.

Examples of operators provided in DirectML


To further enhance performance on the operators that customers need most, we work directly with hardware vendors, like Intel, AMD, and NVIDIA, to directly to provide architecture-specific optimizations, called metacommands. Newer hardware provides advances in ML performance through the use of FP16 precision and designated ML space on chips. DirectML’s metacommands provide vendors a way of exposing those advantages through their drivers to a common interface. Developers save the effort of hand tuning for individual hardware but get the benefits of these innovations.

DirectML is already providing some of these performance advantages by being the underlying foundation of WinML, our high-level inferencing engine that powers applications outside of gaming, like Adobe, Photos, Office, and Intelligent Ink. The API flexes its muscles by enabling applications to run on millions of Windows devices today.


Getting Started

DirectML is available today in the Windows Insider Preview and will be available more broadly in our next release of Windows. To help developers learn this exciting new technology, we provided a few resources below, including samples that show developers how to use DirectML in real-time scenarios and exhibit our recommended best practices.

Documentation: https://docs.microsoft.com/en-us/windows/desktop/direct3d12/dml

Samples: https://github.com/microsoft/DirectML-Samples

If you were unable to attend our GDC talk this year, slides containing more in-depth information about the API and best practices will be available here in the coming days. We will be releasing the super-resolution demo featured in this deck as an open source sample, coming soon. Stay tuned to the GitHub account above.

The post DirectML at GDC 2019 appeared first on DirectX Developer Blog.


New in D3D12 – DirectX Raytracing (DXR) now supports library subobjects

$
0
0

In the next update to Windows, codenamed 19H1, developers can specify DXR state subobjects inside a DXIL library. This provides an easier, flexible, and modular way of defining raytracing state, removing the need for repetitive boilerplate C++ code. This usability improvement was driven by feedback from early adopters of the API, so thanks to all those who took the time to share your experiences with us!

The D3D12RaytracingLibrarySubobjects sample illustrates using library subobjects in an application.

What are library subobjects?

Library subobjects are a way to configure raytracing pipeline state by defining subobjects directly within HLSL shader code. The following subobjects can be compiled from HLSL into a DXIL library:

  • D3D12_STATE_SUBOBJECT_TYPE_STATE_OBJECT_CONFIG
  • D3D12_STATE_SUBOBJECT_TYPE_GLOBAL_ROOT_SIGNATURE
  • D3D12_STATE_SUBOBJECT_TYPE_LOCAL_ROOT_SIGNATURE
  • D3D12_STATE_SUBOBJECT_TYPE_SUBOBJECT_TO_EXPORTS_ASSOCIATION
  • D3D12_STATE_SUBOBJECT_TYPE_RAYTRACING_SHADER_CONFIG
  • D3D12_STATE_SUBOBJECT_TYPE_RAYTRACING_PIPELINE_CONFIG
  • D3D12_STATE_SUBOBJECT_TYPE_HIT_GROUP

A library subobject is identified by a string name, and can be exported from a library or existing collection in a similar fashion to how shaders are exported using D3D12_EXPORT_DESC. Library subobjects also support renaming while exporting from libraries or collections. Renaming can be used to avoid name collisions, and to promote subobject reuse.

This example shows how to define subobjects in HLSL:

GlobalRootSignature MyGlobalRootSignature =
{
    "DescriptorTable(UAV(u0)),"                     // Output texture
    "SRV(t0),"                                      // Acceleration structure
    "CBV(b0),"                                      // Scene constants
    "DescriptorTable(SRV(t1, numDescriptors = 2))"  // Static index and vertex buffers.
};

LocalRootSignature MyLocalRootSignature = 
{
    "RootConstants(num32BitConstants = 4, b1)"  // Cube constants 
};

TriangleHitGroup MyHitGroup =
{
    "",                    // AnyHit
    "MyClosestHitShader",  // ClosestHit
};

ProceduralPrimitiveHitGroup MyProceduralHitGroup
{
    "MyAnyHit",       // AnyHit
    "MyClosestHit",   // ClosestHit
    "MyIntersection"  // Intersection
};

SubobjectToExportsAssociation MyLocalRootSignatureAssociation =
{
    "MyLocalRootSignature",    // Subobject name
    "MyHitGroup;MyMissShader"  // Exports association 
};

RaytracingShaderConfig MyShaderConfig =
{
    16,  // Max payload size
    8    // Max attribute size
};

RaytracingPipelineConfig MyPipelineConfig =
{
    1  // Max trace recursion depth
};

StateObjectConfig MyStateObjectConfig = 
{ 
    STATE_OBJECT_FLAGS_ALLOW_LOCAL_DEPENDENCIES_ON_EXTERNAL_DEFINITONS
};

Note that the subobject names used in an association subobject need not be defined within the same library or even collection, and can be imported from different libraries within same collection or a different collection altogether. In cases where a subobject definition is used from a different collection, the collection that provides the subobject definitions must use the state object config flag D3D12_STATE_OBJECT_FLAG_ALLOW_EXTERNAL_DEPENDENCIES_ON_LOCAL_DEFINITIONS, and the collection which depends on the external definitions of the subobject must specify the config flag D3D12_STATE_OBJECT_FLAG_ALLOW_LOCAL_DEPENDENCIES_ON_EXTERNAL_DEFINITIONS.

Subobject associations at library scope

(this section is included for completeness: most readers can probably ignore these details)

Library subobjects follow rules for default associations. An associable subobject (config or root signature subobject) becomes a candidate for implicit default association if it is the only subobject of its type defined in the library, and if it is not explicitly associated to any shader export. Use of default associable subobject can be explicitly specified by giving an empty list of shader exports in the SubobjectToExportsAssociation definition. Note that the scope of the defaults only applies to the shaders defined in the library. Also note that similar to non-explicit associations, the associable subobjects names specified in SubobjectToExportsAssociation need not be defined in the same library, and this definition can come from a different library or even different collection.

Subobject associations (i.e. config and root signature association between subobjects and shaders) defined at library scope have lower priority than the ones defined at collection or state object scope. This includes all explicit and default associations. For example, an explicit config or root signature association to a hit group defined at library scope can be overridden by an implicit default association at state object scope.

Subobject associations can be elevated to state object scope by using a SubobjectToExportsAssociation subobject at state object scope. This association will have equal priority to other state object scope associations, and the D3D12 runtime will report errors if multiple inconsistent associations are found for a given shader.

Creating Root Signatures from DXIL library bytecode

In DXR, if an application wants to use a global root signature in a DispatchRays() call then it must first bind the global root signature to the command list via SetComputeRootSignature(). For DXIL-defined global root signatures, the application must call SetComputeRootSignature() with an ID3D12RootSignature* that matches the DXIL-defined global root signature. To make this easier for developers, the D3D12 CreateRootSignature API has been updated to accept DXIL library bytecode and will create a root signature from the global root signature subobject defined in that DXIL library. The requirement here is that there should be only one global root signature defined in the DXIL library. The runtime and debug layer will report an error if this API is used with library bytecode having none or multiple global root signatures.

Similarly, the APIs D3D12CreateRootSignatureDeserializer and D3D12CreateVersionedRootSignatureDeserializer are updated to create root signature deserializers from library bytecode that defines one global root signature subobject.

Requirements

Windows SDK version 18282 or higher is required for the DXC compiler update. OS version 18290 or higher is needed for runtime and debug layer binaries. Both are available today through the Windows Insider Program. PIX supports library subobjects as of version 1901.28. This feature does not require a driver update.

The post New in D3D12 – DirectX Raytracing (DXR) now supports library subobjects appeared first on DirectX Developer Blog.

New in D3D12 – GPU-Based Validation (GBV) is now available for Shader Model 6.x

$
0
0

In the next update to Windows, codenamed 19H1, the DirectX12 debug layer adds support for GPU-based validation (GBV) of shader model 6.x (DXIL) as well as the previously supported shader model 5.x (DXBC).

GBV is a GPU timeline validation that modifies and injects validation instructions directly into application shaders. It can provide more detailed validation than is possible using CPU validation alone. In previous Windows releases, GBV modified DXBC shaders to provide validations such as resource state tracking, out-of-bound buffer accesses, uninitialized resource and descriptor bindings, and resource promotion/decay validation. With the 19H1 release, the debug layer provides all these validations for DXIL based shaders as well.

This support is available today in the latest 19H1 builds accessible through the Windows Insider Program.

How to enable GPU-based validation for applications using DXIL shaders

No additional step is needed to enable DXIL GBV. The traditional method is extended to support DXIL based shader patching as well as DXBC:

void EnableShaderBasedValidation()
{
    CComPtr<ID3D12Debug> spDebugController0;
    CComPtr<ID3D12Debug1> spDebugController1;

    VERIFY(D3D12GetDebugInterface(IID_PPV_ARGS(&spDebugController0)));
    VERIFY(spDebugController0->QueryInterface(IID_PPV_ARGS(&spDebugController1)));
    spDebugController1->SetEnableGPUBasedValidation(true);
}

The post New in D3D12 – GPU-Based Validation (GBV) is now available for Shader Model 6.x appeared first on DirectX Developer Blog.

DirectX engineering specs published

$
0
0

Engineering specs for a number of DirectX features, including DirectX Raytracing, Variable Rate Shading, and all of D3D11, are now available at https://microsoft.github.io/DirectX-Specs. This supplements the official API documentation with an extra level of detail that can be useful to expert developers.

The specs are licensed under Creative Commons. We welcome contributions to clarify, add missing detail, or better organize the material.

The post DirectX engineering specs published appeared first on DirectX Developer Blog.

New in D3D12 – background shader optimizations

$
0
0

tl;dr;

In the next update to Windows, codenamed 19H1, D3D12 will allow drivers to use idle priority background CPU threads to dynamically recompile shader programs. This can improve GPU performance by specializing shader code to better match details of the hardware it is running on and/or the context in which it is being used. Developers don’t have to do anything to benefit from this feature – as drivers start to use it, existing shaders will automatically be tuned more efficiently. But developers who are profiling their code may wish to use the new SetBackgroundProcessingMode API to control how and when these optimizations take place.

How shader compilation is changing

Creating a D3D12 pipeline state object is a synchronous operation. The API call does not return until all shaders have been fully compiled into ready-to-execute GPU instructions. This approach is simple, provides deterministic performance, and gives sophisticated applications control over things like compiling shaders ahead of time or compiling several in parallel on different threads, but in other ways it is quite limiting.

Most D3D11 drivers, on the other hand, implement shader creation by automatically offloading compilation to a worker thread. This is transparent to the caller, and works well as long as the compilation has finished by the time the shader is needed. A sophisticated driver might do things like compiling the shader once quickly with minimal optimization so as to be ready for use as soon as possible, and then again using a lower priority thread with more aggressive (and hence time consuming) optimizations. Or the implementation might monitor how a shader is used, and over time recompile different versions of it, each one specialized to boost performance in a different situation. This kind of technique can improve GPU performance, but the lack of developer control isn’t ideal. It can be hard to schedule GPU work appropriately when you don’t know for sure when each shader is ready to use, and profiling gets tricky when drivers can swap the shader out from under you at any time! If you measure 10 times and get 10 different results, how can you be sure whether the change you are trying to measure was an improvement or not?

In the 19H1 update to Windows, D3D12 is adding support for background shader recompilation. Pipeline state creation remains synchronous, so (unlike with D3D11) you always know for sure exactly when a shader is ready to start rendering. But now, after the initial state object creation, drivers can submit background recompilation requests at any time. These run at idle thread priority so as not to interfere with the foreground application, and can be used to implement the same kinds of dynamic optimization that were possible with the D3D11 design. At the same time, we are adding an API to control this behavior during profiling, so D3D12 developers will still be able to measure just once and get one reliable result.

How to use it

  1. Have recent build of Windows 19H1 (as of this writing, available through the Windows Insider Program)
  2. Have a driver that implements this feature
  3. That’s it, you’re done!

Surely there’s more to it?

Well ok. While profiling, you probably want to use SetBackgroundProcessingMode to make sure these dynamic optimizations get applied before you take timing measurements. For example:

SetBackgroundProcessingMode(
    D3D12_BACKGROUND_PROCESSING_MODE_ALLOW_INTRUSIVE_MEASUREMENTS,
    D3D_MEASUREMENTS_ACTION_KEEP_ALL,
    null, null);

// prime the system by rendering some typical content, e.g. a level flythrough

SetBackgroundProcessingMode(
    D3D12_BACKGROUND_PROCESSING_MODE_ALLOWED,
    D3D12_MEASUREMENTS_ACTION_COMMIT_RESULTS,
    null, null);

// continue rendering, now with dynamic optimizations applied, and take your measurements

API details

Dynamic optimization state is controlled by a single new API:

HRESULT ID3D12Device6::SetBackgroundProcessingMode(D3D12_BACKGROUND_PROCESSING_MODE Mode,
                                                   D3D12_MEASUREMENTS_ACTION MeasurementsAction,
                                                   HANDLE hEventToSignalUponCompletion,
                                                   _Out_opt_ BOOL* FurtherMeasurementsDesired);

enum D3D12_BACKGROUND_PROCESSING_MODE
{
    D3D12_BACKGROUND_PROCESSING_MODE_ALLOWED,
    D3D12_BACKGROUND_PROCESSING_MODE_ALLOW_INTRUSIVE_MEASUREMENTS,
    D3D12_BACKGROUND_PROCESSING_MODE_DISABLE_BACKGROUND_WORK,
    D3D12_BACKGROUND_PROCESSING_MODE_DISABLE_PROFILING_BY_SYSTEM,
};

enum D3D12_MEASUREMENTS_ACTION
{
    D3D12_MEASUREMENTS_ACTION_KEEP_ALL,
    D3D12_MEASUREMENTS_ACTION_COMMIT_RESULTS,
    D3D12_MEASUREMENTS_ACTION_COMMIT_RESULTS_HIGH_PRIORITY,
    D3D12_MEASUREMENTS_ACTION_DISCARD_PREVIOUS,
};

The BACKGROUND_PROCESSING_MODE setting controls what level of dynamic optimization will apply to GPU work that is submitted in the future:

  • ALLOWED is the default setting. The driver may instrument workloads and dynamically recompile shaders in a low overhead, non-intrusive manner which avoids glitching the foreground workload.
  • ALLOW_INTRUSIVE_MEASUREMENTS indicates that the driver may instrument as aggressively as possible. Causing glitches is fine while in this mode, because the current work is being submitted specifically to train the system.
  • DISABLE_BACKGROUND_WORK means stop it! No background shader recompiles that chew up CPU cycles, please.
  • DISABLE_PROFILING_BY_SYSTEM means no, seriously, stop it for real! I’m doing an A/B performance comparison, and need the driver not to change ANYTHING that could mess up my results.

MEASUREMENTS_ACTION, on the other hand, indicates what should be done with the results of earlier workload instrumentation:

  • KEEP_ALL – nothing to see here, just carry on as you are.
  • COMMIT_RESULTS indicates that whatever the driver has measured so far is all the data it is ever going to see, so it should stop waiting for more and go ahead compiling optimized shaders. hEventToSignalUponCompletion will be signaled when all resulting compilations have finished.
  • COMMIT_RESULTS_HIGH_PRIORITY is like COMMIT_RESULTS, but also indicates the app does not care about glitches, so the runtime should ignore the usual idle priority rules and go ahead using as many threads as possible to get shader recompiles done fast.
  • DISCARD_PREVIOUS requests to reset the optimization state, hinting that whatever has previously been measured no longer applies.

Note that the DISABLE_BACKGROUND_WORK, DISABLE_PROFILING_BY_SYSTEM, and COMMIT_RESULTS_HIGH_PRIORITY options are only available in developer mode.

What about PIX?

PIX will automatically use SetBackgroundProcessingMode, first to prime the system and then to prevent any further changes from taking place in the middle of its analysis. It will wait on an event to make sure all background shader recompiles have finished before it starts taking measurements.

Since this will be handled automatically by PIX, the detail is only relevant if you’re building a similar tool of your own:

BOOL wantMoreProfiling = true;
int tries = 0;

while (wantMoreProfiling && ++tries < MaxPassesInCaseDriverDoesntConverge)
{
    SetBackgroundProcessingMode(
        D3D12_BACKGROUND_PROCESSING_MODE_ALLOW_INTRUSIVE_MEASUREMENTS,
        (tries == 0) ? D3D12_MEASUREMENTS_ACTION_DISCARD_PREVIOUS : D3D12_MEASUREMENTS_ACTION_KEEP_ALL,
        null, null);

    // play back the frame that is being analyzed

    SetBackgroundProcessingMode(
        D3D12_BACKGROUND_PROCESSING_MODE_DISABLE_PROFILING_BY_SYSTEM,
        D3D12_MEASUREMENTS_ACTION_COMMIT_RESULTS_HIGH_PRIORITY,
        handle,
        &wantMoreProfiling);

    WaitForSingleObject(handle);
}

// play back the frame 1+ more times while collecting timing data,
// recording GPU counters, doing A/B perf comparisons, etc.

The post New in D3D12 – background shader optimizations appeared first on DirectX Developer Blog.

DirectX 12 boosts performance of HITMAN 2

$
0
0

Our partners at IO Interactive, the developers of the award-winning HITMAN franchise, recently added DirectX 12 support to HITMAN 2, with impressive results.  IO Interactive was so excited that they wanted to share a bit about how their innovative use of DirectX 12 benefits HITMAN gamers everywhere.

The guest post below is from IO Interactive:

DirectX 12 boosts performance of HITMAN 2

by Brian Rasmussen, Technical Producer, IO Interactive

With the latest update HITMAN 2 is available for DirectX 12 and users report improved performance in many cases. HITMAN 2 is a great candidate for taking advantage of DirectX 12’s ability to distribute rendering across multiple CPU cores, which allows us to reduce the frame time considerably in many cases. The realized benefits depend on the both the game content and the available hardware.

In this post, we look at how HITMAN 2 uses DirectX 12 to improve performance and provide some guidelines for what to expect.

Highly detailed graphics requires both CPU and GPU work

Figure 1 – The Miami level in Hitman 2 benefits greatly from the multithreaded rendering in DirectX 12

HITMAN 2 levels such as Miami and Mumbai are set in highly detailed environments and populated with big crowds with multiple interaction systems that react intelligently to the player’s actions.

Rendering these game levels often requires more than ten thousand draw calls per frame. This easily becomes a CPU bottleneck as there’s not enough time in a frame to submit all the draw calls to the GPU on a single threaded renderer.

DirectX 12 allows draw calls to be distributed across multiple threads which allows the game engine to submit more rendering work than previously possible. This improves the frame time of exciting game levels and allows us to create new content with even higher level of details in the future.

With its big crowds and complex AI HITMAN 2 is very CPU intensive, so we have built an architecture that allows us to take advantage of the available hardware resources. The Glacier engine powering HITMAN 2 uses a job scheduler to distribute CPU workloads across the available cores, so we already have the necessary engine infrastructure to take advantage of DirectX 12.

Multithreaded rendering

With DirectX 12 we can use the job scheduling mechanism of our game engine to distribute rendering submissions across available CPU cores. For complex game levels this offers substantial reductions in the time needed to submit rendering to the GPU and consequently reduces the frame time significantly.

The graph below shows results from one of our internal stutter analysis performance tests. Vertically it shows frame time (lower is better) and horizontally it shows percentiles for the performance samples. For DirectX 11, 99% of the captured frames rendered in 28.2ms or less on this hardware, and for DirectX 12, 99% of the captured frames rendered in 20.1ms.

The graph shows a significant reduction of the frame time across all the samples leading to a much smoother game experience. For instance, based on the numbers above the game rendered at 35 FPS 99% of the time on DirectX 11. On DirectX 12 this increases to 50 FPS, or close to a 43% improvement.

Figure 2 – The DirectX 12 version of HITMAN 2 shows consistently reduced frame time on complex game levels

The data was gathered on a 6 core Haswell CPU with an AMD Fury X GPU. We expect to see performance improvements on PCs with a similar or better GPU and at least four available CPU cores.

For less capable systems we recommend staying with the DirectX 11 version of HITMAN 2. Our DirectX 11 implementation offers slightly better performance on lower end systems. DirectX 12 requires additional work on the part of the game, so in some cases the overhead of this may result in poorer performance compared to the DirectX 11 version. We are still optimizing our DirectX 12 implementation and we expect to see improved performance on additional configurations, but currently DirectX 11 may be the best option for players with less capable systems.

We hope this new version of HITMAN 2 provides a better experience for some players and look forward to hearing your feedback.

The post DirectX 12 boosts performance of HITMAN 2 appeared first on DirectX Developer Blog.

Viewing all 291 articles
Browse latest View live


<script src="https://jsc.adskeeper.com/r/s/rssing.com.1596347.js" async> </script>